Content from Introduction
Last updated on 2023-07-19 | Edit this page
Overview
Questions
- What is OpenRefine useful for?
Objectives
- Describe OpenRefine’s uses and applications.
- Differentiate data cleaning from data organization.
- Experiment with OpenRefine’s user interface.
Motivations for the OpenRefine Lesson
- Data is often very messy. OpenRefine provides a set of tools to allow you to identify and amend the messy data.
- It is important to know what you did to your data. Additionally, journals, granting agencies, and other institutions are requiring documentation of the steps you took when working with your data. With OpenRefine, you can capture all actions applied to your raw data and share them with your publication as supplemental material.
- All actions are easily reversed in OpenRefine.
- If you save your work it will be to a new file. OpenRefine always uses a copy of your data and does not modify your original dataset.
- Data cleaning steps often need repeating with multiple files. OpenRefine keeps track of all of your actions and allows them to be applied to different datasets.
- Some concepts such as clustering algorithms are quite complex, but OpenRefine makes it easy to introduce them, use them, and show their power.
Features
- Open source (source on GitHub).
- A large growing community, from novice to expert, ready to help. See Getting Help section below.
- Works with large-ish datasets (100,000 rows). Can adjust memory allocation to accommodate larger datasets.
- OpenRefine always keeps your data private on your own computer until you choose to share it. It works by running a small server on your computer and using your web browser to interact with it, but your private data never leaves your computer unless you want it to.
Before we get started
Note: this is a Java program that runs on your machine (not in the cloud). It runs inside your browser, but no web connection is needed.
Follow the Setup instructions to install OpenRefine.
If after installation and running OpenRefine, it does not automatically open for you, point your browser at http://127.0.0.1:3333/ or http://localhost:3333 to launch the program.
Key Points
- OpenRefine is a powerful, free, and open source tool that can be used for data cleaning.
- OpenRefine will automatically track any steps allowing you to backtrack as needed and providing a record of all work done.
Content from Working with OpenRefine
Last updated on 2023-09-19 | Edit this page
Overview
Questions
- How can we bring our data into OpenRefine?
- How can we sort and summarize our data?
- How can we find and correct errors in our raw data?
Objectives
- Create a new OpenRefine project from a CSV file.
- Understand potential problems with file headers.
- Use facets to summarize data from a column.
- Use clustering to detect possible typing errors.
- Understand that there are different clustering algorithms which might give different results.
- Employ drop-downs to remove white spaces from cells.
- Manipulate data using previous steps with undo/redo.
Creating a new OpenRefine project
If you have not started OpenRefine yet, follow the Setup instructions before continuing.
OpenRefine can import a variety of file types, including tab
separated (tsv), comma separated (csv), Excel
(xls, xlsx), JSON, XML, RDF as XML, and Google
Spreadsheets. See the OpenRefine
Create a Project by Importing Data page for more information.
In this first step, we’ll browse our computer to the sample data file for this lesson. In this case, we will be using data obtained from interviews of farmers in two countries in eastern sub-Saharan Africa (Mozambique and Tanzania). If you haven’t yet downloaded the data, see the instructions on downloading the data in Setup.
Once OpenRefine is launched in your browser, the left margin has
options to Create Project, Open Project, or
Import Project. Here we will create a new project:
Click
Create Projectand selectGet data fromThis Computer.Click
Choose Filesand select the fileSAFI_openrefine.csvthat you downloaded in the setup step. ClickOpenor double-click on the filename.Click
Next>>under the browse button to upload the data into OpenRefine.OpenRefine gives you a preview - a chance to show you it understood the file. If, for example, your file was really tab-delimited, the preview might look strange. You would then choose the correct separator in the box shown and click
Update Preview(middle right). If this is the wrong file, click<<Start Over(upper left). There are also options to indicate whether the dataset has column headers included and whether OpenRefine should skip a number of rows before reading the data.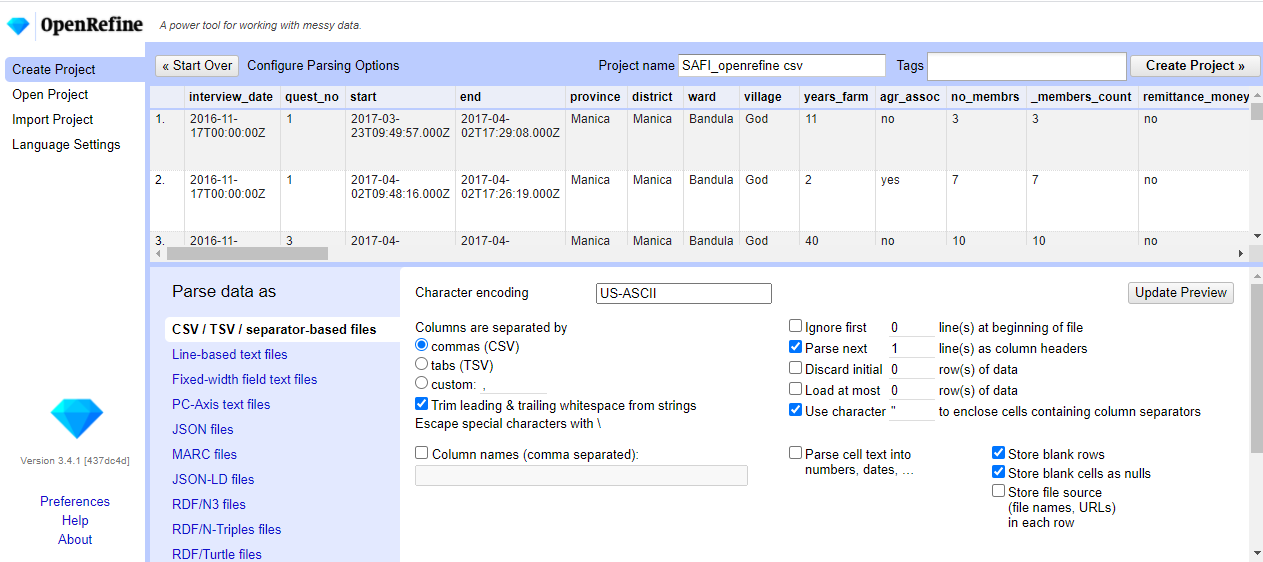
If all looks well, click
Create Project>>(upper right).
Note that at step 1, you could upload data in a standard form from a
web address by selecting Get data from
Web Addresses (URLs). The URLs must point to data in a file
type that OpenRefine understands, just like the types that you could
upload. Instead of downloading the dataset file as you did during setup and uploading it from your computer, you
could have submitted its URL here. Fully understanding this
functionality is out of scope for this lesson. The OpenRefine
manual’s section on importing from Web addresses (URLs) provides
further information.
Using Facets
Exploring data by applying multiple filters
Facets are one of the most useful features of OpenRefine and can help both get an overview of the data in a project as well as help you bring more consistency to the data. OpenRefine supports faceted browsing as a mechanism for
- seeing a big picture of your data, and
- filtering down to just the subset of rows that you want to change in bulk.
A ‘Facet’ groups all the like values that appear in a column, and then allows you to filter the data by these values and edit values across many records at the same time.
One type of Facet is called a ‘Text facet’. This groups all the identical text values in a column and lists each value with the number of records it appears in. The facet information always appears in the left hand panel in the OpenRefine interface.
Here we will use faceting to look for potential errors in data entry
in the village column.
Finding (potential) errors
- Scroll over to the
villagecolumn. - Click the down arrow and choose
Facet>Text facet. - In the left panel, you’ll now see a box containing every unique
value in the
villagecolumn along with a number representing how many times that value occurs in the column. - Try sorting this facet by name and by count. Do you notice any problems with the data? What are they?
- Hover the mouse over one of the names in the
Facetlist. You should see that you have aneditfunction available. - You could use this to fix an error immediately, and OpenRefine will ask whether you want to make the same correction to every value it finds like that one. But OpenRefine offers even better ways to find and fix these errors, which we’ll use instead. We’ll learn about these when we talk about clustering.
-
Chirdozois likely a mis-entry ofChirodzo. -
Rucais likely a mis-entry ofRuaca. -
Ruaca - NhamuendaandRuaca-Nhamuendarefer to the same place (differ only by spaces around the hyphen). You might also wonder if both of these are the same asRuaca. We will see how to correct these misspelled and mistyped entries in a later exercise. - The entry
49is almost certainly an error but you will not be able to fix it by reference to other data.
Interview collection dates
Using faceting, find out how many different
interview_datevalues there are in the survey results.Is the column formatted as Text or Date?
Use faceting to produce a timeline display for
interview_date. You will need to useEdit cells>Common transforms>To dateto convert this column to dates.During what period were most of the interviews collected?
For the column interview_date do Facet >
Text facet. A box will appear in the left panel showing
that there are 19 unique entries in this column. By default, the column
interview_date is formatted as Text. You can change the
format by doing Edit cells >
Common transforms > To date.
Notice the the values in the column turn green. Doing
Facet > Timeline facet creates a box in the
left panel that shows a histogram of the number of entries for each
date.
Most of the data was collected in November of 2016.
Other types of Facets
Please see the OpenRefine Manual section on Facets for reference information on all types of facets.
Besides ‘Text facets’ OpenRefine also supports several other types of facet. These include:
- Numeric facets
- Timeline facets (for dates)
- Custom facets
- Scatterplot facets
Numeric and Scatterplot facets display graphs instead of lists of values. The numeric facet graph includes ‘drag and drop’ controls you can use to set a start and end range to filter the data displayed. A scatterplot facet allows you to visualise values in a pair of numeric columns as a scatterplot, so that you can filter by two-value combinations.
Custom facets are a range of different types of facets. Some of the default custom facets are:
- Word facet - this breaks down text into words and counts the number of records each word appears in
- Duplicates facet - this results in a binary facet of ‘true’ or ‘false’. Rows appear in the ‘true’ facet if the value in the selected column is an exact match for a value in the same column in another row
- Text length facet - creates a numeric facet based on the length (number of characters) of the text in each row for the selected column. This can be useful for spotting incorrect or unusual data in a field where specific lengths are expected (e.g. if the values are expected to be years, any row with a text length more than 4 for that column is likely to be incorrect)
- Facet by blank - a binary facet of ‘true’ or ‘false’. Rows appear in the ‘true’ facet if they have no data present in that column. This is useful when looking for rows missing key data.
Bookmark a project with facets and filters
OpenRefine saves the project continuously so that you can close the browser and use “Open Project” from the start page to continue the work. However, any facets and filters (discussed in the next episode) are not saved. To save the exact view, you can bookmark the “Permalink” that is to the right of the project name in the top left corner of the screen.
Using clustering to detect possible typing errors
In OpenRefine, clustering means “finding groups of different values
that might be alternative representations of the same thing”. For
example, the two strings New York and new york
are very likely to refer to the same concept and just have
capitalization differences. Likewise, Gödel and
Godel probably refer to the same person. Clustering is a
very powerful tool for cleaning datasets which contain misspelled or
mistyped entries. OpenRefine has several clustering algorithms built in.
Experiment with them, and learn more about these algorithms and how they
work.
- In the
villageText Facet we created in the step above, click theClusterbutton. - In the resulting pop-up window, you can change the
Methodand theKeying Function. Try different combinations to see what different mergers of values are suggested. - Select the
key collisionmethod andmetaphone3keying function. It should identify two clusters. - Click the
Merge?box beside each cluster, then clickMerge Selected and Reclusterto apply the corrections to the dataset. - Try selecting different
MethodsandKeying Functionsagain, to see what new merges are suggested. - You should find that using the default settings, no more clusters
are found, for example to merge
Ruaca-NhamuendawithRuacaorChirdozowithChirodzo. (Note that thenearest neighbormethod withppmdistance,radius≥ 4, andblock chars≤ 4 will find these clusters, as well as other settings withlevenshteindistance) - To merge these values we will hover over them in the village text
facet, select edit, and manually change the names. Change
ChirdozotoChirodzoandRuaca-NhamuendatoRuaca. You should now have four clusters:Chirodzo,God,Ruacaand49.
Important: If you Merge using a different method or
keying function, or more times than described in the instructions above,
your solutions for later exercises will not be the same as shown in
those exercise solutions.
The manual’s section on clustering provides technical details on how the different clustering algorithms work.
Transforming data
The data in the items_owned column is a set of items in
a list. The list is in square brackets and each item is in single
quotes. Before we split the list into individual items in the next
section, we first want to remove the brackets and the quotes.
Click the down arrow at the top of the
items_ownedcolumn. ChooseEdit Cells>Transform...This will open up a window into which you can type a GREL expression. GREL stands for General Refine Expression Language.
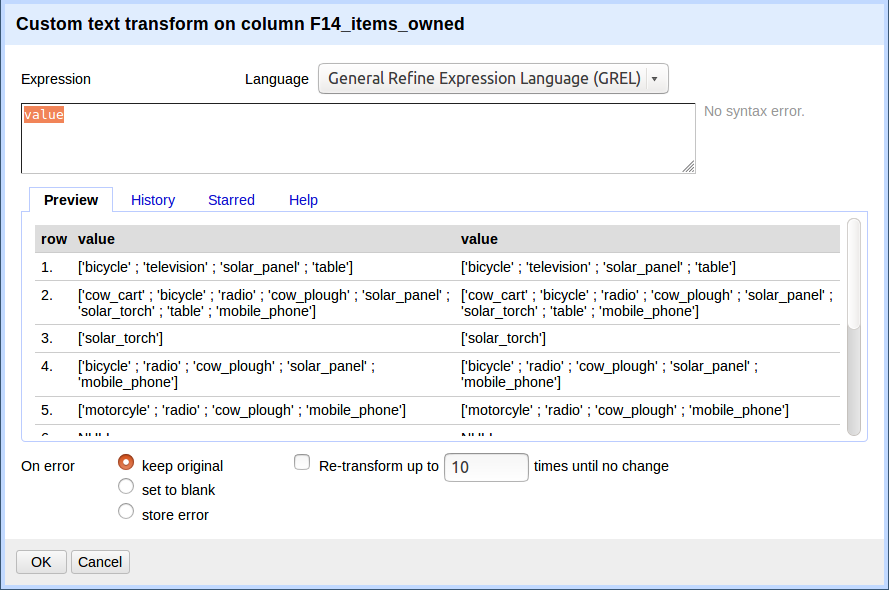
First we will remove all of the left square brackets (
[). In the Expression box typevalue.replace("[", "")and clickOK.What the expression means is this: Take the
valuein each cell in the selected column and replace all of the “[” with “” (i.e. nothing - delete).Click
OK. You should see in theitems_ownedcolumn that there are no longer any left square brackets.
Remove unwanted characters
Use this same strategy to remove the single quote marks
('), the right square brackets (]), and spaces
from the items_owned column.
value.replace("'", "")value.replace("]", "")-
value.replace(" ", "")You should now have a list of items separated by semi-colons (;).
Now that we have cleaned out extraneous characters from our
items_owned column, we can use a text facet to see which
items were commonly owned or rarely owned by the interview
respondents.
- Click the down arrow at the top of the
items_ownedcolumn. ChooseFacet>Custom text facet... - In the
Expressionbox, typevalue.split(";"). - Click
OK.
You should now see a new text facet box in the left-hand pane.
Commonly owned items
Which two items are the most commonly owned? Which are the two least commonly owned?
Select Sort by: count. The most commonly
owned items are mobile phone and radio, the least commonly owned are
cars and computers.
Month(s) with farmers lacking food
Perform the same clean up steps and customized text faceting for the
months_lack_food column. Which month(s) were farmers more
likely to lack food?
All four cleaning steps can be performed by combining
.replace statements. The command is:
value.replace("[", "").replace("]", "").replace(" ", "").replace("'", "")
This can also be done in four separate steps if preferred. November was
the most common month for respondents to lack food.
Clean up other columns
Perform the same clean up steps for the months_no_water,
liv_owned, res_change, and
no_food_mitigation columns. Hint: To reuse a GREL command,
click the History tab and then click Reuse
next to the command you would like to apply to that column.
Using undo and redo
It’s common while exploring and cleaning a dataset to discover after
you’ve made a change that you really should have done something else
first. OpenRefine provides Undo and Redo
operations to make this easy.
Explore undo and redo
- Click where it says
Undo / Redoon the left side of the screen. All the changes you have made so far are listed here. - Click on the step that you want to go back to, in this case go back several steps to before you had done any text transformation.
- Visually confirm that those columns now contain the special characters that we had removed previously.
- Notice that you can still click on the later steps to
Redothe actions. Before moving on to the next lesson, redo all the steps in your analysis so that all of the columns you modified are lacking in square brackets, spaces, and single quotes.
Trim Leading and Trailing Whitespace
Sometimes spaces (or tabs, or newline characters) will be present at the beginning or end of a text cell. They may have been in the dataset that was imported, or appear when you perform operations on the data, such as splitting text. While we as humans cannot always see or notice these (especially if they are at the end of a word), a computer always sees them. These spaces are often unwanted variations that should to be removed.
As of version 3.4, OpenRefine provides the option to trim (i.e. remove) leading and trailing whitespace during the import of data (see image at the top of this page). This is then applied to the data in all columns.
OpenRefine also provides a menu option to remove blank characters from the beginning and end of any entries in the column that you choose.
Remove a trailing space
- Edit the
villageon the first row to introduce a space at the end, set toGod. - Create a new text facet for the
villagecolumn. You should now see two different entries forGod, one of which has a trailing whitespace. - To remove the whitespace, choose
Edit cells>Common transforms>Trim leading and trailing whitespace. - You should now see only four choices in your text facet again.
Key Points
- OpenRefine can import a variety of file types.
- OpenRefine can be used to explore data using filters.
- Clustering in OpenRefine can help to identify different values that might mean the same thing.
- OpenRefine can transform the values of a column.
Content from Filtering and Sorting with OpenRefine
Last updated on 2023-06-12 | Edit this page
Overview
Questions
- How can we select only a subset of our data to work with?
- How can we sort our data?
Objectives
- Filter to a subset of rows by text filter or include/exclude.
- Sort table by a column.
- Sort by multiple columns.
Filtering
There are many entries in our data table. We can filter it to work on a subset of the data in the list for the next set of operations. Please ensure you perform this step to save time during the class.
Using a Text Filter
- Click the down arrow next to
respondent_roof_type>Text filter. Arespondent_roof_typefacet will appear on the left margin. - Type in
mabatand press return. There are 58 matching rows of the original 131 rows (and these rows are selected for the subsequent steps). - At the top, change the view to
Show50rows. This way you will see most of the matching rows. - Answer these questions:
- What roof types are selected by this procedure?
- How would you restrict this to only one of the roof types?
- Do
Facet>Text faceton therespondent_roof_typecolumn after filtering. This will show that two names match your filter criteria. They aremabatipitchedandmabatisloping. - To restrict to only one of these two roof types, you could include more letters in your filter.
Excluding entries
In addition to the simple text filtering we used above, another way
to narrow our filter is to include and/or
exclude entries in a facet. You will see the
include or exclude options if you hover over
the name in the facet window.
If you still have your facet for respondent_roof_type,
you can use it, or use drop-down menu > Facet >
Text facet to create a new facet. Only the entries with
names that agree with your Text filter will be included in
this facet.
Faceting and filtering look very similar. A good distinction is that faceting gives you an overview description of all of the data that is currently selected, while filtering allows you to select a subset of your data for analysis.
Including and excluding rows using a facet
Use include / exclude to select only entries from one of
these two roof types.
- In the facet (left margin), click on one of the names, such as
mabatisloping. Notice that when you click on the name, or hover over it, there are entries to the right foreditandinclude. - Click
include. This will explicitly include this roof type, and exclude others that are not explicitly included. Notice that the option now changes toexclude. - Click
includeandexcludeon the other roof type and notice how the two entries appear and disappear from the table.
Remove the filter before moving on so that you again have the full dataset of 131 records.
Sort
You can sort the data by a column by using the drop-down menu in that
column. There you can sort by text, numbers,
dates or booleans (TRUE or
FALSE values). You can also specify what order to put
Blanks and Errors in the sorted results.
If this is your first time sorting this table, then the drop-down
menu for the selected column shows Sort.... Select what you
would like to sort by (such as numbers). Additional options
will then appear for you to fine-tune your sorting.
Finding GPS Altitude outliers
Sort the data by gps_Altitude. Do you think the first
few entries may have incorrect altitudes?
In the gps_Altitude column, select Sort...
> numbers and select smallest first. The
first few values are all 0. The altitudes are more likely ‘missing’ than
incorrect. The survey is delivered by Smartphone with the gps
information added automatically by the app. The lack of an altitude
value suggests that the smartphone was unable to provide it and it
defaulted to 0.
If you try to re-sort a column that you have already used, the
drop-down menu changes slightly, to > Sort without the
..., to remind you that you have already used this column.
It will give you additional options:
-
Sort>Sort...- This option enables you to modify your original sort. -
Sort>Reverse- This option allows you to reverse the order of the sort. -
Sort>Remove sort- This option allows you to undo your sort.
Sorting by multiple columns
You can sort by multiple columns by performing sort on additional
columns. The sort will depend on the order in which you select columns
to sort. To restart the sorting process with a particular column, check
the sort by this column alone box in the Sort
pop-up menu.
If you go back to one of the already sorted columns and select >
Sort > Remove sort, that column is removed
from your multiple sort. If it is the only column sorted, then data
reverts to its original order.
Finding village “49”
We discovered in an earlier lesson that the value for one of the
village entries was given as 49. This is clearly wrong. By
looking at the GPS coordinates for the entries of the other villages can
we decide what village the data in that column was collected from?
- Sort on
gps_Latitudeas a number with the smallest first. - Add a sort on
gps_Longitudeas a number with the smallest first. - Using the drop down arrow on the
villagecolumn, selectEdit column>Move column to end. This will allow you to compare village names with GPS coordinates. - Scroll through the entries until you find village
49. Can you tell from it’s GPS coordinates which village it belong to? - Now sort only by
interview_dateas date. Move thevillagecolumn to the start of the table. Does the row where village is49group with one particular village? Is it the same village as when comparing GPS coordinates?
The interview data for that row is in a small cluster of Chirodzo interviews when sorting by GPS coordinates. When sorting by interview date, it is also with Chirodzo interviews. In fact, only Chirodzo had interviews conducted on that date.
Perform a text facet on the village column and change
49 to the village name that was determined in the previous
exercise. You should now have only three village names.
Key Points
- OpenRefine provides a way to sort and filter data without affecting the raw data.
Content from Examining Numbers in OpenRefine
Last updated on 2023-06-12 | Edit this page
Overview
Questions
- How can we convert a column from one data type to another?
- How can we find non-numeric values in a column that should contain numbers?
Objectives
- Transform a text column into a number column.
- Identify and modify non-numeric values in a numeric column using facets.
Numbers
When a table is imported into OpenRefine, all columns are treated as
containing text values. We saw earlier how we can sort column values as
numbers, but this does not change the cells in a column from text to
numbers. Rather, this interprets the values as numbers for the purposes
of sorting but keeps the underlying data type as is. We can, however,
transform columns from text to other data types (e.g. number or date)
using the Edit cells > Common transforms
feature. Here we will experiment changing columns to numbers and see
what additional capabilities that grants us.
Be sure to remove any Text filter facets you have
enabled from the left panel so that we can examine our whole dataset.
You can remove an existing facet by clicking the x in the
upper left of that facet window.
To transform cells in the years_farm column to numbers,
click the down arrow for that column, then Edit cells >
Common transforms… > To number. You will
notice the years_farm values change from left-justified to
right-justified, and black to green in color.
Transforming column contents to numbers
Transform three more columns, no_membrs,
years_liv, and buildings_in_compound, from
text to numbers. Can all columns be transformed to numbers? - Try it
with village for example.
Only observations that include only numerals (0-9) can be transformed
to numbers. If you apply a number transformation to a column that
doesn’t meet this criteria, and then click the Undo / Redo
tab, you will see a step that starts with
Text transform on 0 cells. This means that the data in that
column was not transformed.
Numeric facet
Sometimes non-numeric values or blanks occur in a column where
numbers are expected. Such values may represent errors in data entry,
and we want to find them. We can do that with a
Numeric facet.
Using a numeric facet
- For a column you transformed to numbers, edit one or two cells,
replacing the numbers with text (such as
abc) or blank (no number or text). You will need to change theData typetotextusing the drop-down menu. - Use the column pulldown menu to apply a numeric facet to the column you edited. The facet will appear in the left panel.
- Notice that there are several checkboxes in this facet:
Numeric,Non-numeric,Blank, andError. Below these checkboxes are counts of the number of cells in each category. You should see checks forNon-numericandBlankif you changed some values. - Experiment with checking or unchecking these boxes to select subsets of your data.
When done examining the numeric data, remove this facet by clicking
the x in the upper left corner of its panel. Note that this
does not undo the edits you made to the cells in this column. Use the
Undo / Redo function to reverse these changes.
Key Points
- OpenRefine also provides ways to to examine and clean numerical data.
Content from Using scripts
Last updated on 2023-06-12 | Edit this page
Overview
Questions
- How can we document the data-cleaning steps we’ve applied to our data?
- How can we apply these steps to additional data sets?
Objectives
- Describe how OpenRefine generates JSON code representing the work done in an analysis session.
- Demonstrate ability to export this JSON code from OpenRefine.
- Demonstrate ability to import a JSON code file to apply the analysis to another dataset.
How OpenRefine records what you have done
As you conduct your data cleaning and preliminary analysis, OpenRefine saves every change you make to the dataset. These changes are saved in a format known as JSON (JavaScript Object Notation). You can export this JSON script and apply it to other data files. If you had 20 files to clean, and they all had the same type of errors (e.g. misspellings, leading white spaces), and all files had the same column names, you could save the JSON script, open a new file to clean in OpenRefine, paste in the script and run it. This gives you a quick way to clean all of your related data.
Saving your work as a script
- In the
Undo / Redosection, clickExtract..., and select the steps that you want to apply to other datasets by clicking the check boxes.
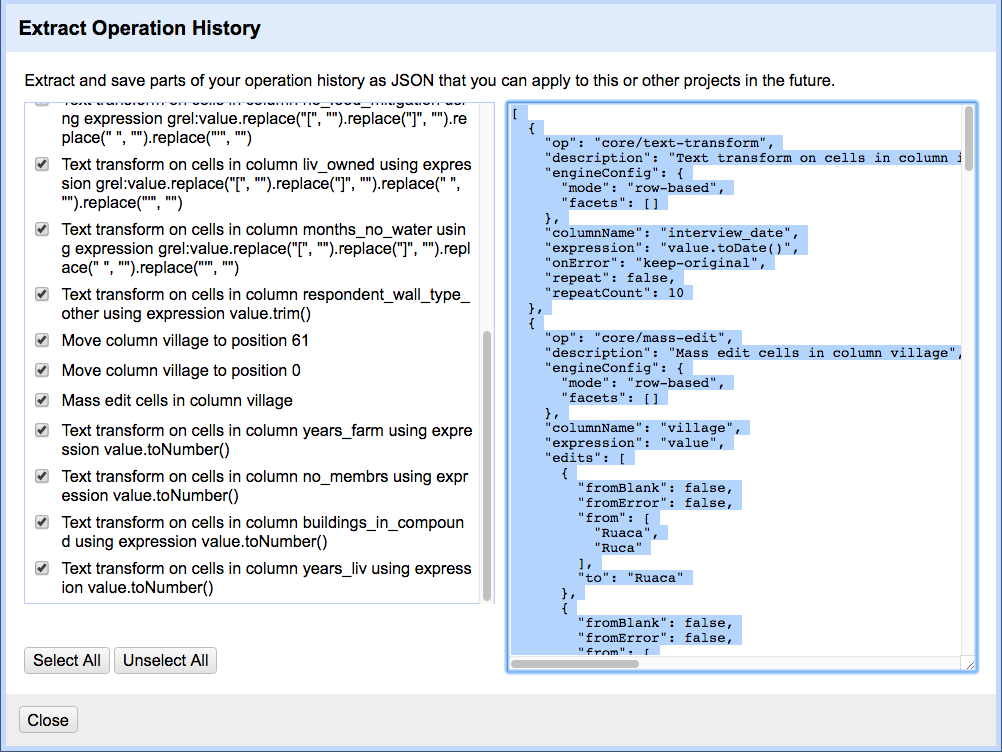
- Copy the code from the right hand panel and paste it into a text
editor (like NotePad on Windows or TextEdit on Mac). Make sure it saves
as a plain text file. In TextEdit, do this by selecting
Format>Make plain textand save the file as a.txtfile.
Importing a script to use against another dataset
Let’s practice running these steps on a new dataset. We’ll test this on an uncleaned version of the dataset we’ve been working with.
- Start a new project in OpenRefine using the messy dataset you downloaded before. Give the project a new name.
- Click the
Undo / Redotab >Applyand paste in the contents of.txtfile with the JSON code. - Click
Perform operations. The dataset should now be the same as your other cleaned dataset.
For convenience, we used the same dataset. In reality you could use this process to clean related datasets. For example, data that you had collected over different fieldwork periods or data that was collected by different researchers (provided everyone uses the same column headings). The data in this file was generated from an eSurvey system with the actual survey being delivered centrally to a smartphone, so the column headings are pretty much guaranteed to be the same.
Key Points
- All changes are being tracked in OpenRefine, and this information can be used for scripts for future analyses or reproducing an analysis.
Content from Exporting and Saving Data from OpenRefine
Last updated on 2023-07-24 | Edit this page
Overview
Questions
- How can we get our cleaned data out of OpenRefine?
- How can we save the whole project with all history as a file?
Objectives
- Export cleaned data from an OpenRefine project.
- Save an OpenRefine project as a shareable file.
Exporting Cleaned Data
When you completed the cleaning steps, you probably want to save the cleaned dataset as a new file, so that you can further analyse the data using other applications. OpenRefine allows you to do so by exporting the data in various file formats.
- Click
Exportin the top right and select the file type you want to export the data in.Tab-separated values(tsv) orComma-separated values(csv) would be good choices. - OpenRefine creates a file whose name is based on the project name and asks the browser to download it. Depending on your browser settings, this file is automatically saved in the default location for downloaded files, or you see a dialog window to choose where you want to save the file.
The downloaded file can then be opened in a spreadsheet program or imported into programs written in R or Python, for example.
Remember from our lesson on Spreadsheets that using widely-supported,
non-proprietary file formats like tsv or csv
improves the ability of yourself and others to use your data.
Only matching rows are exported
OpenRefine only operates on rows that match all enabled filters. This is also true for exporting data. So if you want to export a selection from a larger dataset, you can use filters and facets to select what data you want to export.
However, if you wanted to export all data and forget to reset all facets and filters, the exported dataset may appear to be incomplete. OpenRefine does not provide a warning about enabled filters when you export data.
Saving a Project as a File
Next to exporting the data, you can export the project as well. When you export the project, OpenRefine creates a single file that includes the data and all the information about the cleaning and data transformation steps that you have taken.
You can use this file as a project backup, transfer it to another computer to continue working on the data or share it with a collaborator who can open it to see what you did and continue the work.
Saving happens automatically
By default OpenRefine is saving your project continuously while you work on it. If you close OpenRefine and open it up again, you can see a list of your projects when you select “Open Project” on the start screen. You can open an existing project by clicking on its title.
Exporting and examining the project
In this exercise, we will export the project and examine the contents of the exported file.
- Click the
Exportbutton in the top right and selectOpenRefine project archive to file. - OpenRefine then presents a
tar.gzfile for download. Depending on your browser you may have to specify where you want to save the file, or it may be downloaded to your default directory for downloaded files. Thetar.gzextension tells you that this is a compressed file. The downloadedtar.gzfile is actually a folder of files which have been compressed. Linux and Mac machines will have software installed to automatically expand this type of file when you double-click on it. For Windows based machines you may have to install a utility like ‘7-zip’ in order to expand the file and see the files in the folder. - After you have expanded the file, look at the files that appear in this folder. What files are here? What information do you think these files contain?
You should see:
- a
historyfolder which contains a collection ofzipfiles. Each of these files itself contains achange.txtfile. Thesechange.txtfiles are the records of each individual transformation that you did to your data. - a
data.zipfile. When expanded, thiszipfile includes a file calleddata.txtwhich is a copy of your raw data. You may also see other files.
Importing a Project
You can import an existing project into OpenRefine by clicking
Open... in the upper right, then opening the
Import Project tab and selecting the tar.gz
project file.
Key Points
- Cleaned data, or selected data, can be exported from OpenRefine for use in other applications.
- Projects can be exported to files that contain the original data and all data cleaning steps you performed.
Content from Other Resources in OpenRefine
Last updated on 2023-06-30 | Edit this page
Overview
Questions
- What other resources are available for working with OpenRefine?
Objectives
- Understand that there are many online resources available for more information on OpenRefine.
- Locate helpful resources to learn more about OpenRefine.
Getting help for OpenRefine
You can find out a lot more about OpenRefine at openrefine.org and check out some great introductory videos.
These videos and others on OpenRefine can also be found on YouTube by searching under ‘OpenRefine’. There is an official forum that can answer a lot of beginner questions and problems. Information can also be found on StackOverflow where you can find a lot of help. As with other programs of this type, OpenRefine libraries are available too, where you can find a script you need and copy it into your OpenRefine instance to run it on your dataset.
Using online resources to get help with OpenRefine
OpenRefine is more than a simple data cleaning tool. People are using it for all sorts of activities. Here are some other resources that might prove useful.
OpenRefine has its own web site with documentation and a book:
- OpenRefine web site
- OpenRefine User Manual
- Using OpenRefine book by Ruben Verborgh, Max De Wilde and Aniket Sawant
- OpenRefine history from Wikipedia
In addition, see these other useful resources:
- Grateful Data is a fun site with many resources devoted to OpenRefine, including a nice tutorial.
There are more advanced uses of OpenRefine, such as bringing in column or cell data using web locators (URLs or APIs). The links above can give you a start on your journey.
Discuss a resource
Visit one of these sites and share what you find with another person.
Key Points
- Other examples and resources online are good for learning more about OpenRefine.