Filtering and Sorting with OpenRefine
Last updated on 2023-05-09 | Edit this page
Overview
Questions
- How can we select only a subset of our data to work with?
- How can we sort our data?
Objectives
- Employ text filter or include/exclude to filter to a subset of rows.
- Sort tables by a column.
- Sort tables by multiple columns.
Filtering
Sometimes you want to view and work only with a subset of data or apply an operation only to a subset. You can do this by applying various filters to your data.
Including/excluding data entries on facets
One way to filter down our data is to use the include or
exclude buttons on the entries in a text facet. If you
still have your text facet for scientificName, you can use
it. If you’ve closed that facet, recreate it by selecting
Facet > Text facet on the
scientificName column.
- In the text facet, hover over one of the names, e.g. Baiomys
taylori. Notice that when you hover over it, there are buttons to
the right for
editandinclude. - Whilst hovering over Baiomys taylori, move to the right and
click the
includeoption. This will include this species, as signified by the name of the species changing from blue to orange, and new options ofeditandexcludewill be presented. Note that in the top of the page, “33 matching rows” is now displayed instead of “790 rows”. - You can include other species in your current filter - e.g. click on Chaetodipus baileyi in the same way to include it in the filter.
- Alternatively, you can click the name of the species to include it
in the filter instead of clicking the
include/excludebuttons. This will include the selected species and exclude all others options in a single step, which can be useful. - Click
includeandexcludeon the other species and notice how the entries appear and disappear from the data table to the right.
Click on Reset at the top-right of the facet before
continuing to the next step.
Text filters
One way to filter data is to create a text filter on a column. Close
all facets you may have created previously and reinstate the text facet
on the scientificName column.
Click the down arrow next to
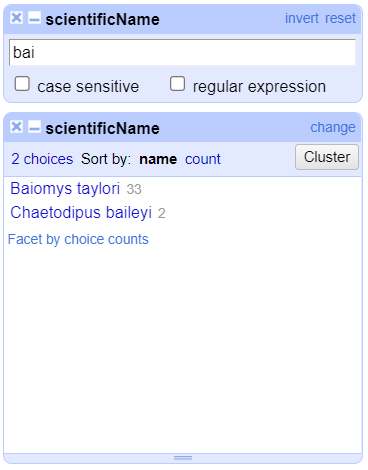
scientificName>Text filter. AscientificNamefilter will appear on the left margin below the text facet.Type in
baiinto the text box in the filter and press return. At the top of the page it will report that, out of the 790 rows in the raw data, there are 35 rows in which the text has been found within thescientificNamecolumn (and these rows will be selected for the subsequent steps).
- Near the top of the screen, change
Show:to 50. This way, you will see all the matching rows in a single page.
Exercise
- What scientific names are selected by this text filter?
- How would you restrict the filter to one of the species selected?
- Do
Facet>Text faceton thescientificNamecolumn after filtering. This will show that two names match your filter criteria. They are Baiomys taylori and Chaetodipus baileyi. - To restrict to only one of these two species, you could:
- Check the
case sensitivebox within thescientificNamefacet. Once you do this, you will see that using the upper-caseBaiwill only > > return Baiomys taylori, while using lower-casebaiwill only return Chaetodipus baileyi. - You could include more letters in your filter (i.e. typing
baiowill exclusively return Baiomys taylori, whilebailwill only return Chaetodipus baileyi).
Filters vs. facets
Faceting and filtering look very similar. A good distinction is that faceting gives you an overview of all the data that is currently selected, while filtering allows you to select a subset of your data for further inspection and analysis.
Important: Make sure both species (Baiomys taylori and Chaetodipus baileyi) are included in your filtered dataset before continuing with the rest of the exercises.
Sort
Sorting data is a useful practice for detecting outliers in data - potential errors and blanks will sort to the top or the bottom of your data.
You can sort the data in a column by using the drop-down menu
available in that column. There you can sort by text,
numbers, dates or booleans
(TRUE or FALSE values). You can also specify
what order to put Blanks and Errors in the
sorted results.
If this is your first time sorting this table, then the drop-down
menu for the selected column shows Sort.... Select what you
would like to sort by (such as numbers). Additional options
will then appear for you to fine-tune your sorting.
Exercise
Sort by month. How can you ensure that months are in order?
In the mo column, select Sort... >
numbers and select smallest first. The months
are listed from 1 (for January) through 12 (December).
If you try to re-sort a column that you have already used, the
drop-down menu changes slightly, to > Sort without the
..., to remind you that you have already used this column.
It will give you additional options:
Sort>Sort...- This option enables you to modify your original sort.Sort>Reverse- This option allows you to reverse the order of the sort.Sort>Remove sort- This option allows you to undo your sort.
Exercise
Sort the data by plot. What year(s) were observations
recorded for plot 1 in this filtered dataset?
In the plot column, select Sort... >
numbers and select smallest first. The years
represented include 1990 and 1995.
Sorting by multiple columns
You can sort by multiple columns by performing sort on additional
columns. The sort will depend on the order in which you select columns
to sort. To restart the sorting process with a particular column, check
the sort by this column alone box in the Sort
pop-up menu.
Exercise
You might like to look for trends in your data by month of collection across years.
- How do you sort your data by month?
- How would you do this differently if you were instead trying to see all of your entries in chronological order?
- For the
mocolumn, click onSort...and thennumbers. This will group all entries made in, for example, January, together, regardless of the year that entry was collected. - For the
yrcolumn, click onSort>Sort...>numbersand selectsort by this column alone. This will undo the sorting by month step. Once you’ve sorted byyryou can then apply another sorting step to sort by month within year. To do this for themocolumn, click onSort>numbersbut do not selectsort by this column alone. To ensure that all entries are shown chronologically, you will need to also sort by days within each month. Click on thedycolumn thenSort>numbers. Your data should now be in chronological order.
If you go back to one of the already sorted columns and select >
Sort > Remove sort, that column is removed
from your multiple sort. If it is the only column sorted, then data
reverts to its original order.
Exercise
Sort by year, month and day in
some order. Be creative: try sorting as numbers or
text, and in reverse order
(largest to smallest or z to a).
Use Sort > Remove sort to remove the
sort on the second of three columns. Notice how that changes the
order.
Key Points
- OpenRefine provides various ways to sort and filter data without affecting the raw data.