Exploring Data with OpenRefine
Last updated on 2023-09-22 | Edit this page
Overview
Questions
- How can we summarise our data?
- How can we find errors in our data?
- How can we edit data to fix errors?
- How can we convert column data from one data type to another?
Objectives
- Learn about different types of facets and how they can be used to summarise data of different data types
Exploring data with facets
Facets are one of the most useful features of OpenRefine. Data faceting is a process of exploring data by applying multiple filters to investigate its composition. It also allows you to identify a subset of data that you wish to change in bulk.
A facet groups all the like values that appear in a
column, and allows you to filter the data by those values. It also
allows you to edit values across many records at the same time.
Exploring text columns
One type of facet is called a ‘Text facet’. This groups all the identical text values in a column and lists each value with the number of records it appears in. The facet information always appears in the left hand panel in the OpenRefine interface.
Here we will use faceting to look for potential errors in data entry
in the scientificName column.
Scroll over to the
scientificNamecolumn.Click the down arrow and choose
Facet>Text facet.

- In the left panel, you’ll now see a box containing every unique
value in the
scientificNamecolumn along with a number representing how many times that value occurs in the column.
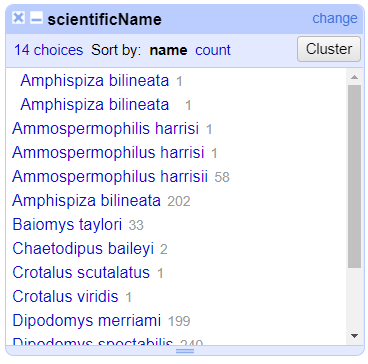
Try sorting this facet by name and by count. Do you notice any problems with the data? What are they?
Hover the mouse over one of the names in the
facetlist. You should see that you have aneditfunction available.You could use this to fix an error immediately, and OpenRefine will ask whether you want to make the same correction to every value it finds like that one. But OpenRefine offers even better ways to find and fix these errors, which we’ll use instead. We’ll learn about these when we talk about clustering.
Facets and large datasets
Facets are intended to group together common values and OpenRefine limits the number of values allowed in a single facet to ensure the software does not perform slowly or run out of memory. If you create a facet where there are many unique values (for example, a facet on a ‘book title’ column in a data set that has one row per book) the facet created will be very large and may either slow down the application, or OpenRefine will not create the facet.
Exercise
- Using faceting, find out how many years are represented in the census.
- Which years have the most and least observations?
- Is the column formatted as Number, Date, or Text?
- For the column
yrdoFacet>Text facet. A box will appear in the left panel showing that there are 16 unique entries in this column. - After creating a facet, click
Sort by countin the facet box. The year with the most observations is 1978. The least is 1993. - By default, the column
yris formatted as Text.
Exploring numeric columns
When a table is imported into OpenRefine, all columns are treated as
having text values. We can transform columns to other data types
(e.g. number or date) using the Edit cells >
Common transforms feature. Here we will experiment changing
columns to numbers and see what additional capabilities that grants
us.
Numeric facet
Sometimes there are non-number values or blanks in a column which may
represent errors in data entry and we want to find them. We can do that
with a Numeric facet.
Create a numeric facet for the column yr.
The facet will be empty because OpenRefine sees all the values as
text.
To transform cells in the yr column to numbers, click
the down arrow for that column, then Edit cells >
Common transforms… > To number. You will
notice the yr values change from left-justified to
right-justified, and black to green color.
Exercise
The dataset included other numeric columns that we will explore in this exercise:
-
period- Unique number assigned to each survey period -
plot- Plot number animal was caught on, from 1 to 24 -
recordID- Unique record ID number to facilitate quick reference to particular entry
Transform the columns period, plot, and
recordID from text to numbers.
- How does changing the format change the faceting display for the
yrcolumn? - Can all columns be transformed to numbers?
Displaying a Numeric facet of yr shows a
histogram of the number of entries per year. Notice that the data is
shown as a number, not a date. If you instead transform the column to a
date, the program will assume all entries are on January 1st of the
year.
Only observations that include only numerals (0-9) can be transformed to numbers. If you apply a number transformation to a column that doesn’t meet this criteria, and then click the Undo / Redo tab, you will see a step that starts with Text transform on 0 cells. This means that the data in that column was not transformed.
The next exercise will explore what happens when a numeric column contains values that are not numbers.
Exercise
- For a column you transformed to numbers, edit one or two cells,
replacing the numbers with text (such as
abc) or blank (no number or text). - Use the pulldown menu to apply a numeric facet to the column you edited. The facet will appear in the left panel.
- Notice that there are several checkboxes in this facet:
Numeric,Non-numeric,Blank, andError. Below these are counts of the number of cells in each category. You should see checks forNon-numericandBlankif you changed some values. - Experiment with checking or unchecking these boxes to select subsets of your data.
When done examining the numeric data, remove this facet by clicking
the x in the upper left corner of its panel. Note that this
does not undo the edits you made to the cells in this column.
Examine a pair of numeric columns using scatterplots
Now that we have multiple columns representing numbers, we can see
how they relate to one another using the scatterplot facet. Select a
numeric column, for example recordID, and use the pulldown
menu to > Facet > Scatterplot facet. A
new window called Scatterplot Matrix will appear. There are
squares for each pair of numeric columns organized in an upper right
triangle. Each square has little dots for the cell values from each
row.
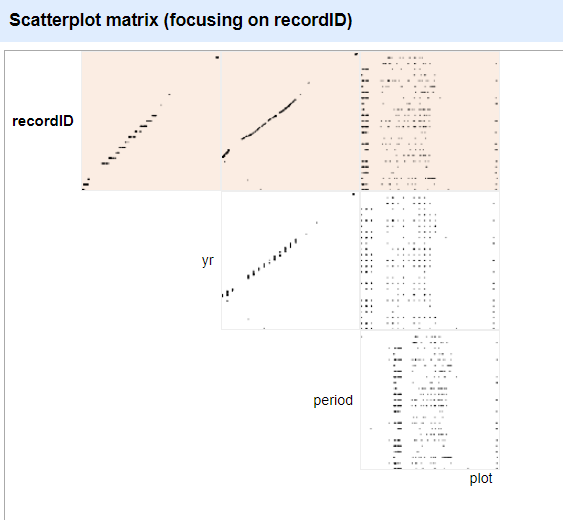
Click the image of the scatterplot between recordID and
yr to select this one for the facet.
Exercise
Click in the scatterplot facet in the lower left margin and drag to highlight a rectangle. How does this change the data rows displayed?
More Details on Faceting
Full documentation on faceting can be found at Exploring facets: Faceting
Key Points
- Faceting can identify errors or outliers in data