Megafaunal Extinction (Reproduction)
There were a relatively large number of extinctions of mammalian species roughly 10,000 years ago. To help understand why these extinctions happened scientists are interested in understanding if there were differences in the size of the species that went extinct and those that did not. You are going to reproduce the three main figures from one of the major papers on this topic Lyons et al. 2004.
You will do this using a large dataset of mammalian body sizes that has data on the mass of recently extinct mammals as well as extant mammals (i.e., those that are still alive today).
- Import the data into R. As with most real world data there are a some things about the dataset that you’ll need to identify and address during the import process. Print out the structure of the resulting data frame.
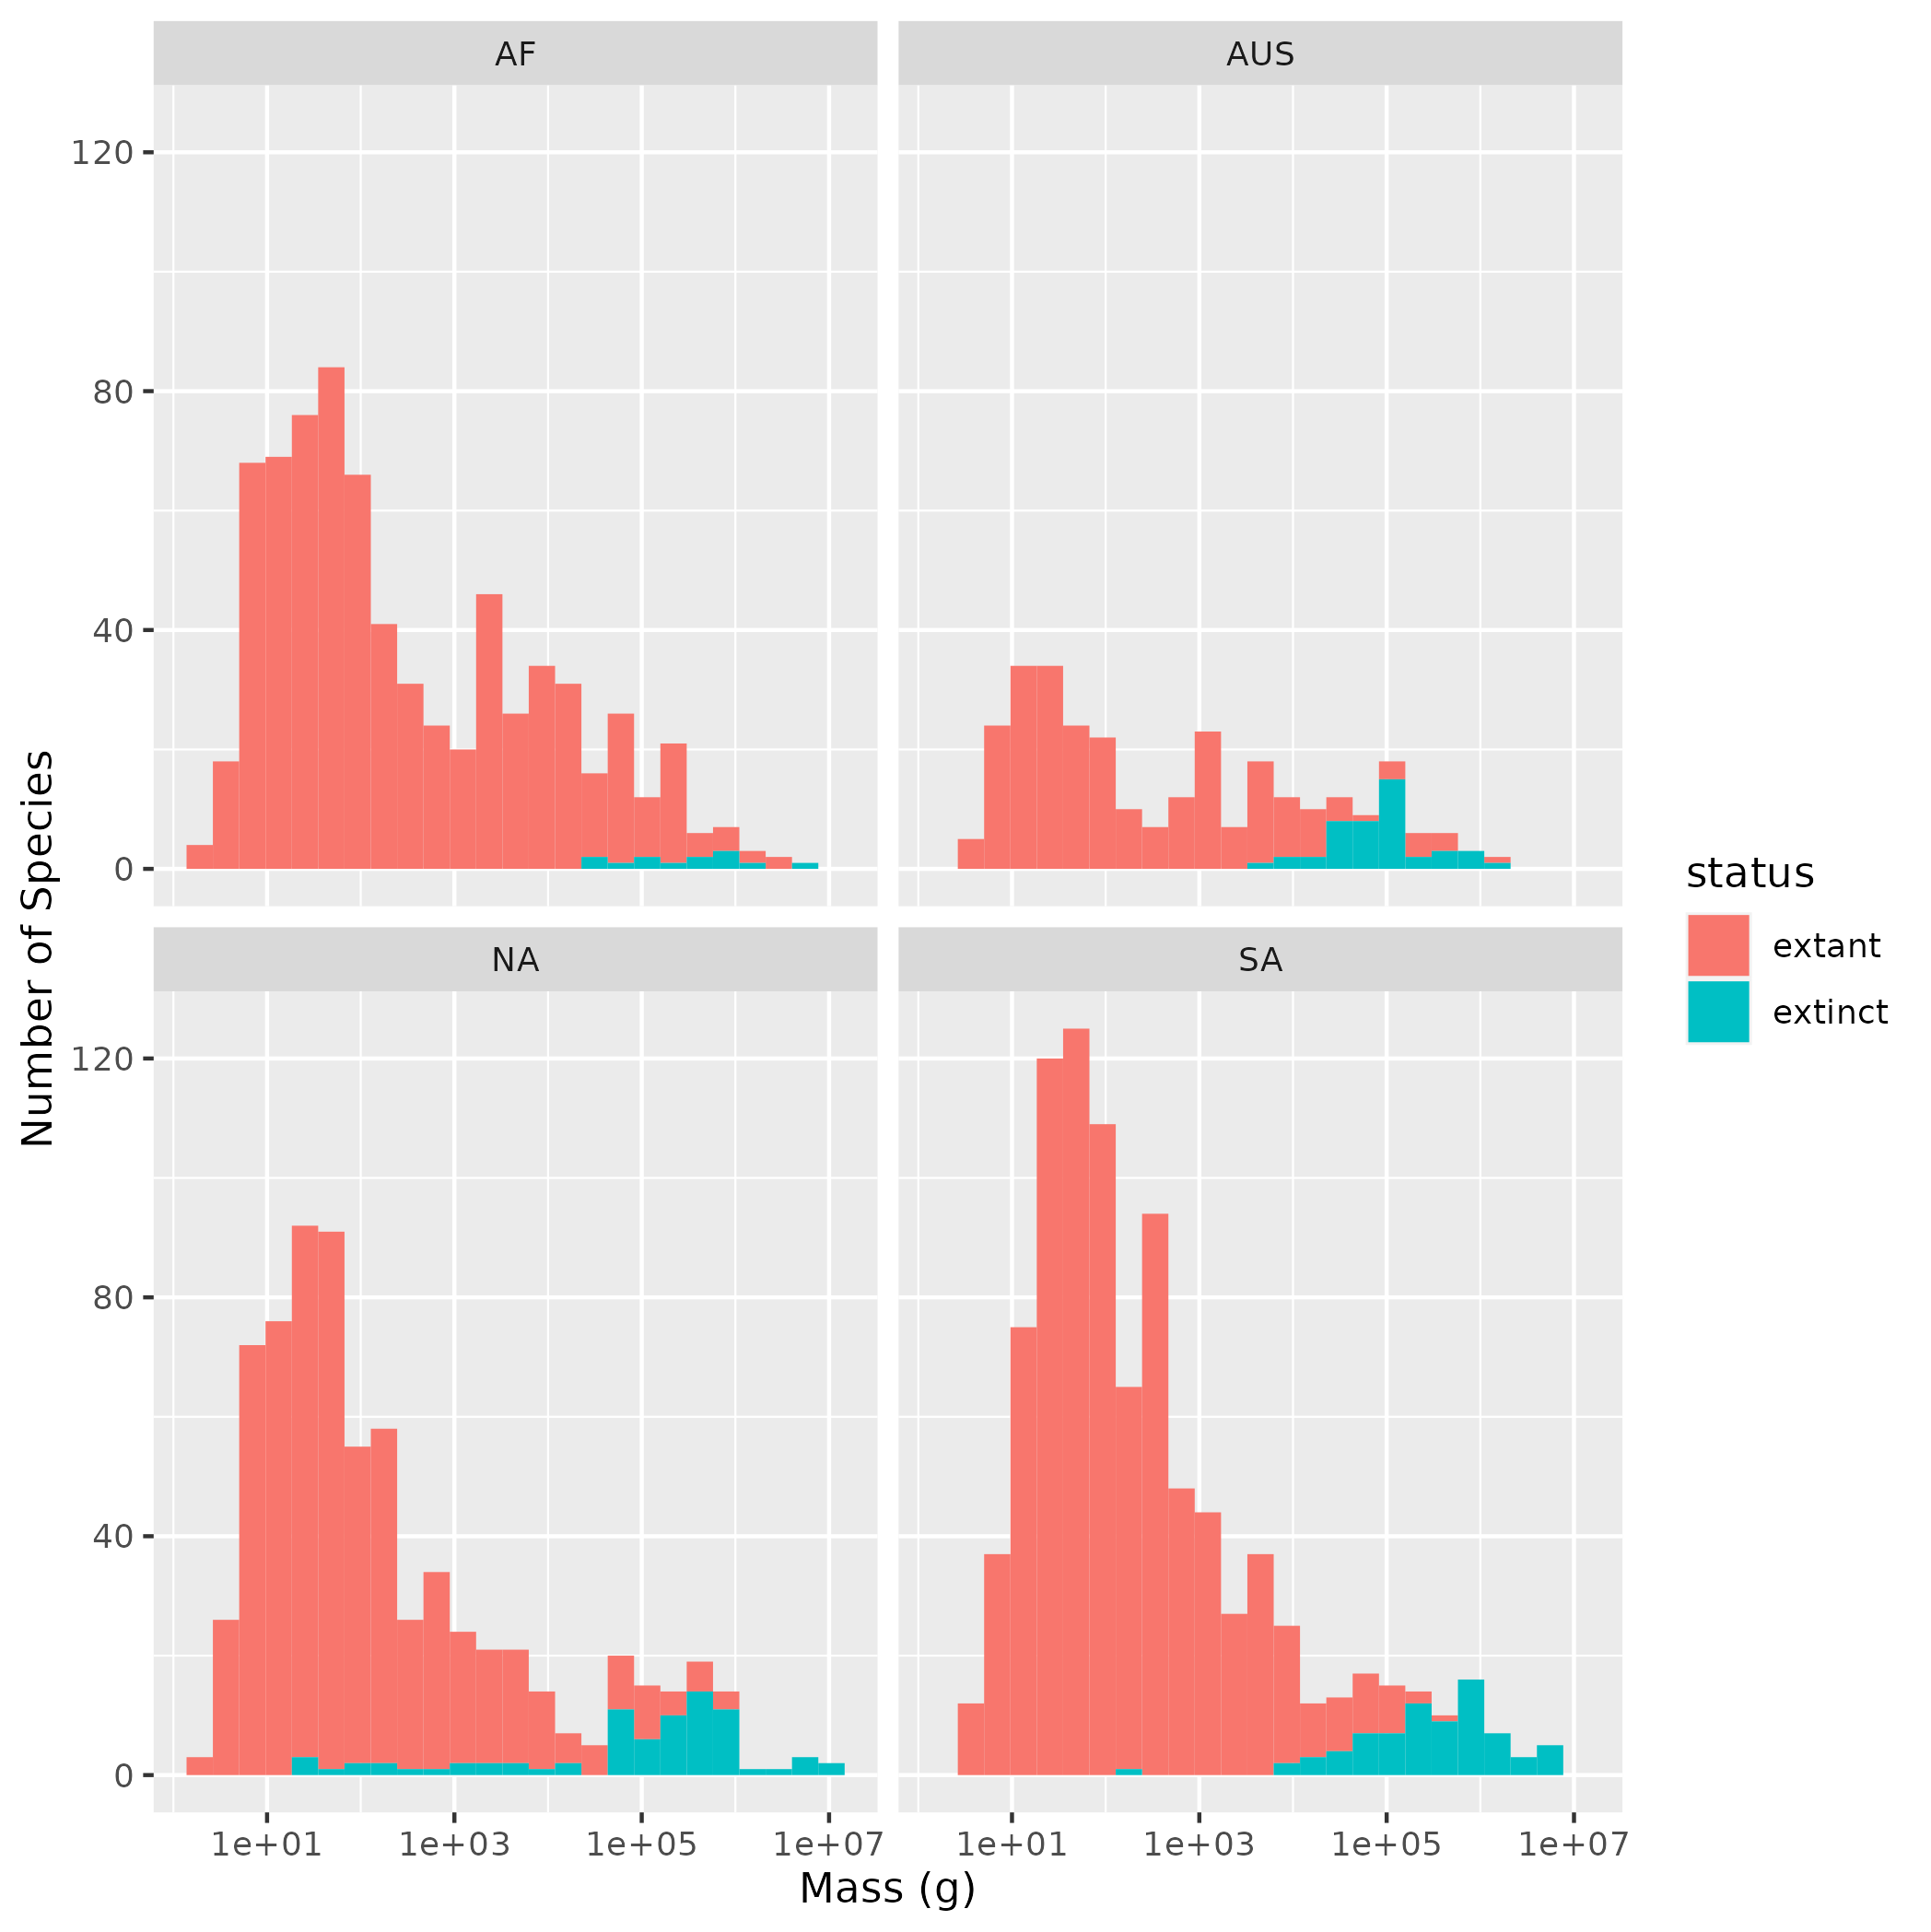
- Create a plot showing histograms of masses for mammal species that are still
present and those that went extinct during the pleistocene (
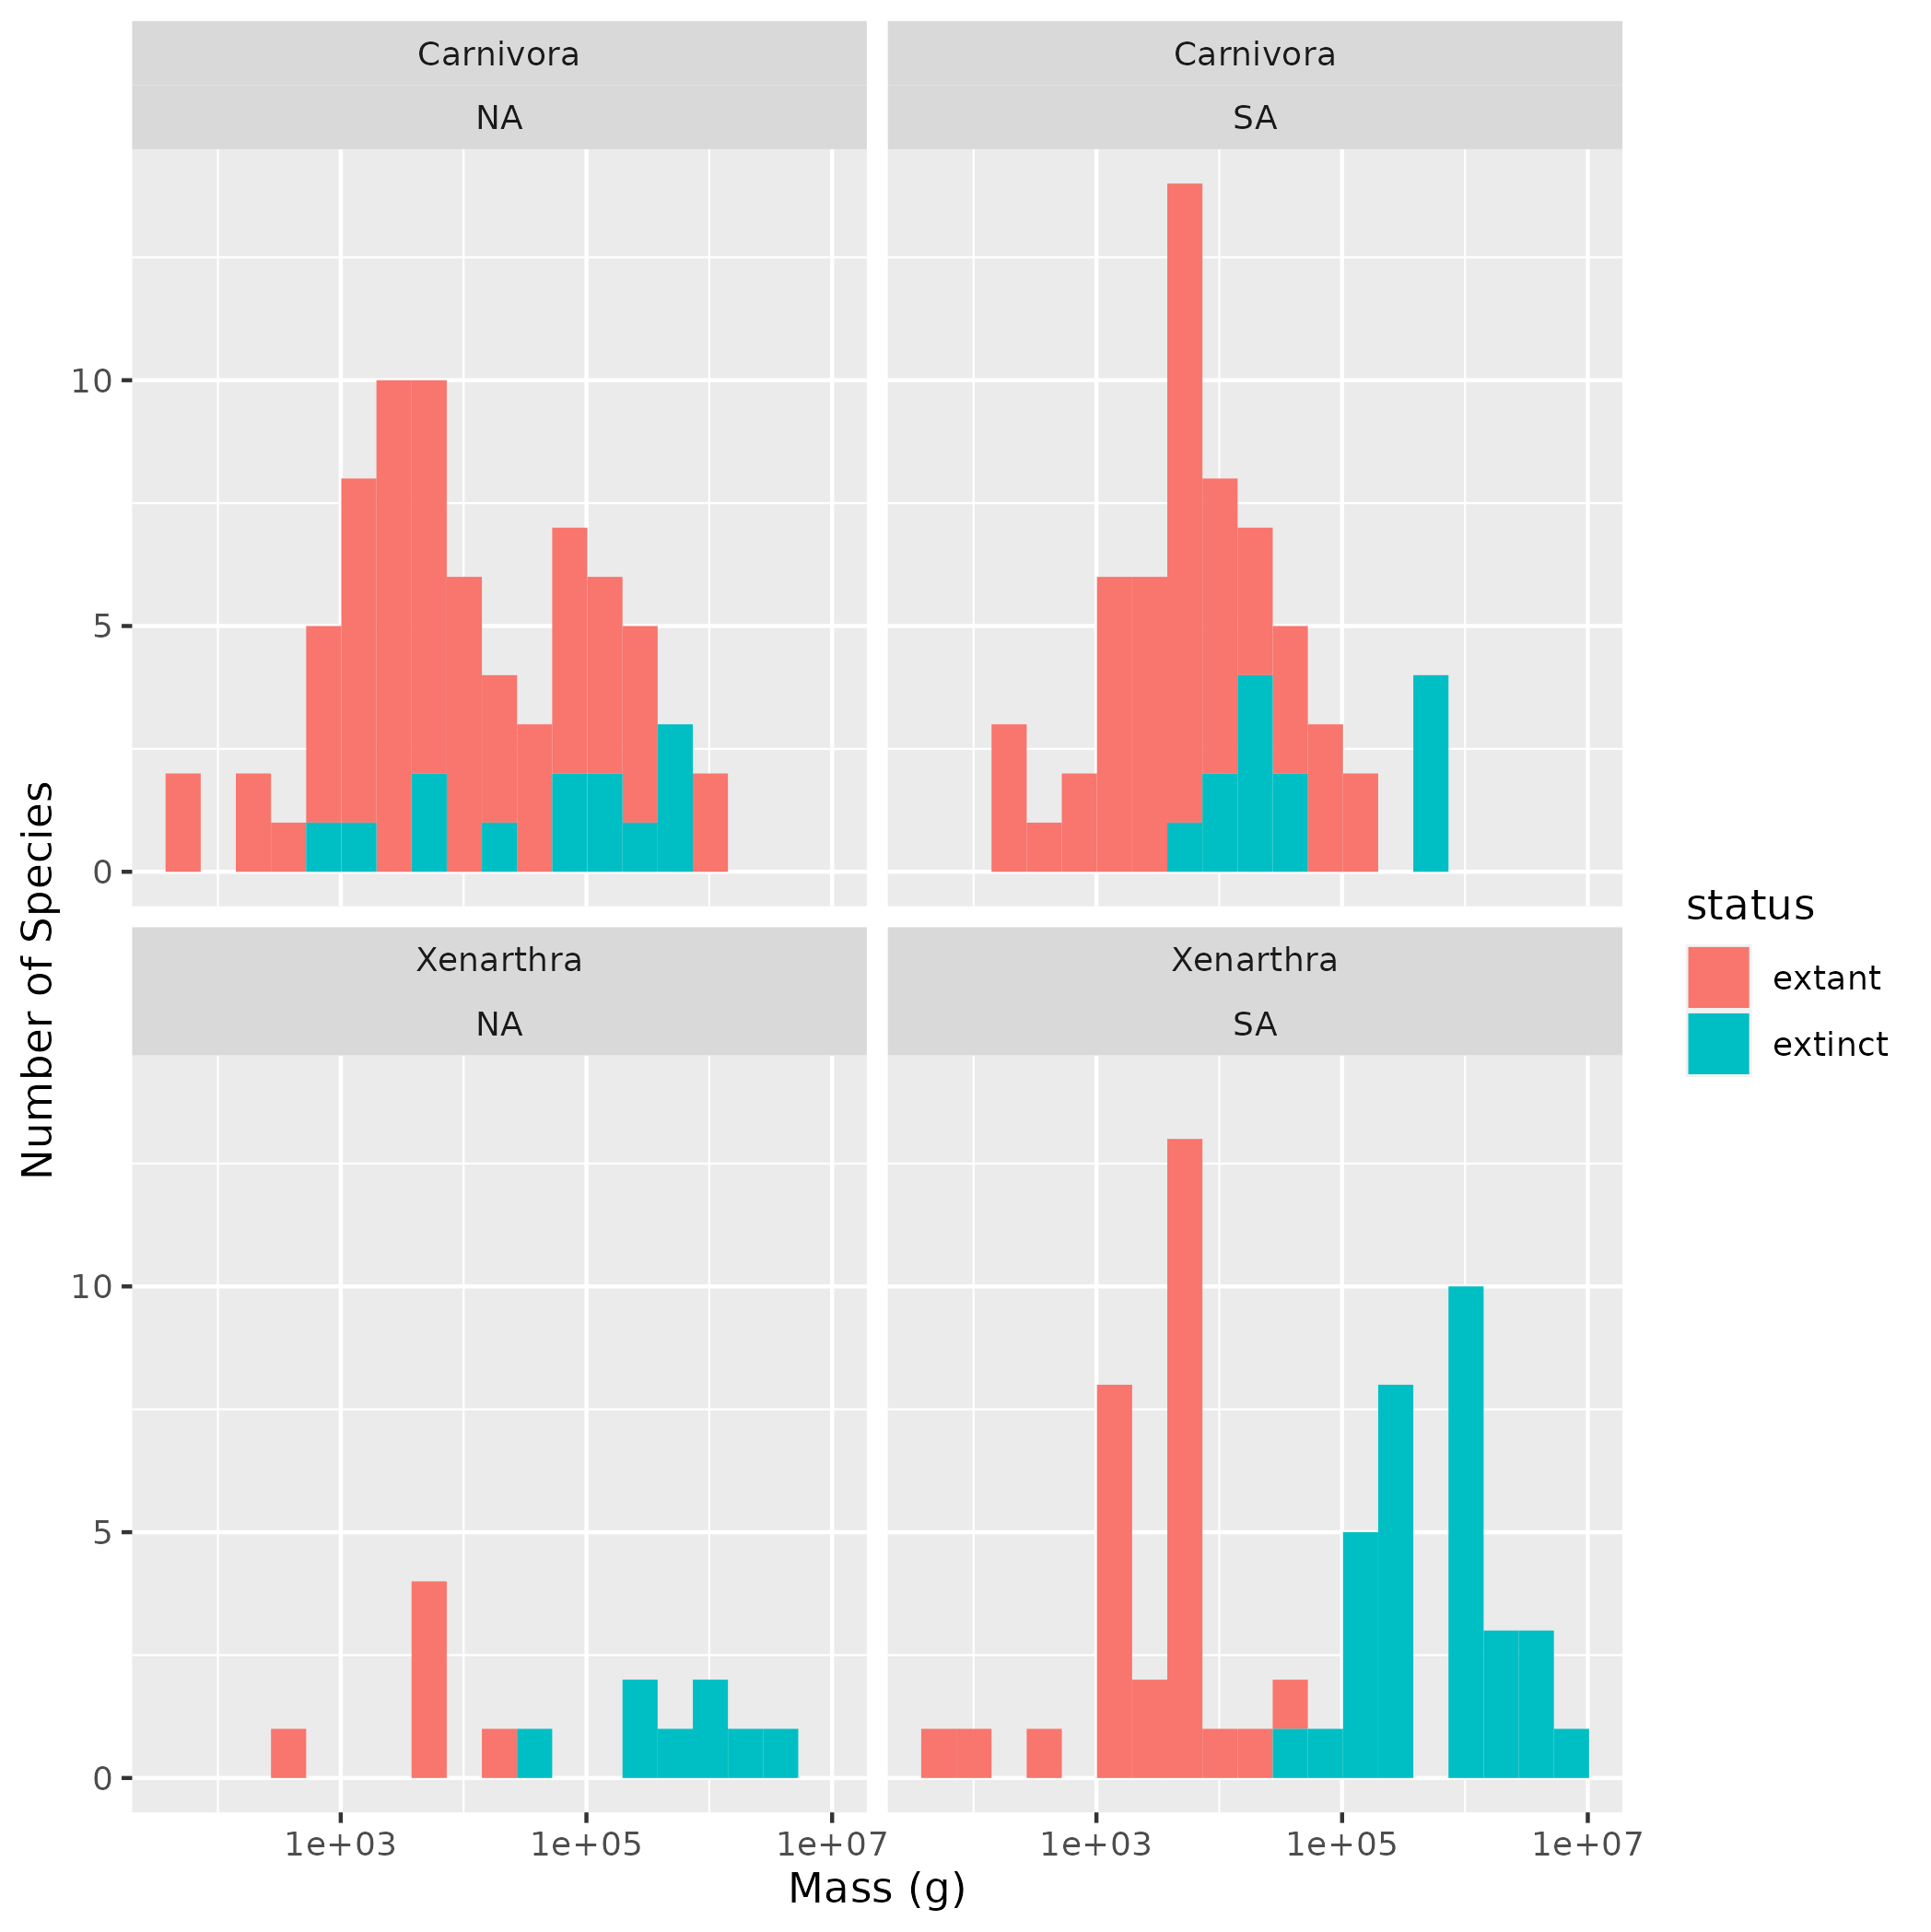
extantandextinctin thestatuscolumn). There should be one sub-plot for each continent and that sub-plot should show the histograms for both groups as a stacked histogram. To match the original analysis don’t include islands (InsularandOceanicin thecontinentcolumn) and or the continent labeledEA(becauseEAhad no species that went extinct in the pleistocene). Scale the x-axis logarithmically and use 25 bins to roughly match the original figure. Use good axis labels. - The 2nd figure in the original paper looks in more detail at two orders, Xenarthra and Carnivora, which showed extinctions in North and South America. Create a figure similar to the one in Part 2, but that shows 4 sub-plots, one for each order on each of the two continents. Still scale the x-axis logarithmically, but use 19 bins to roughly match the original figure.
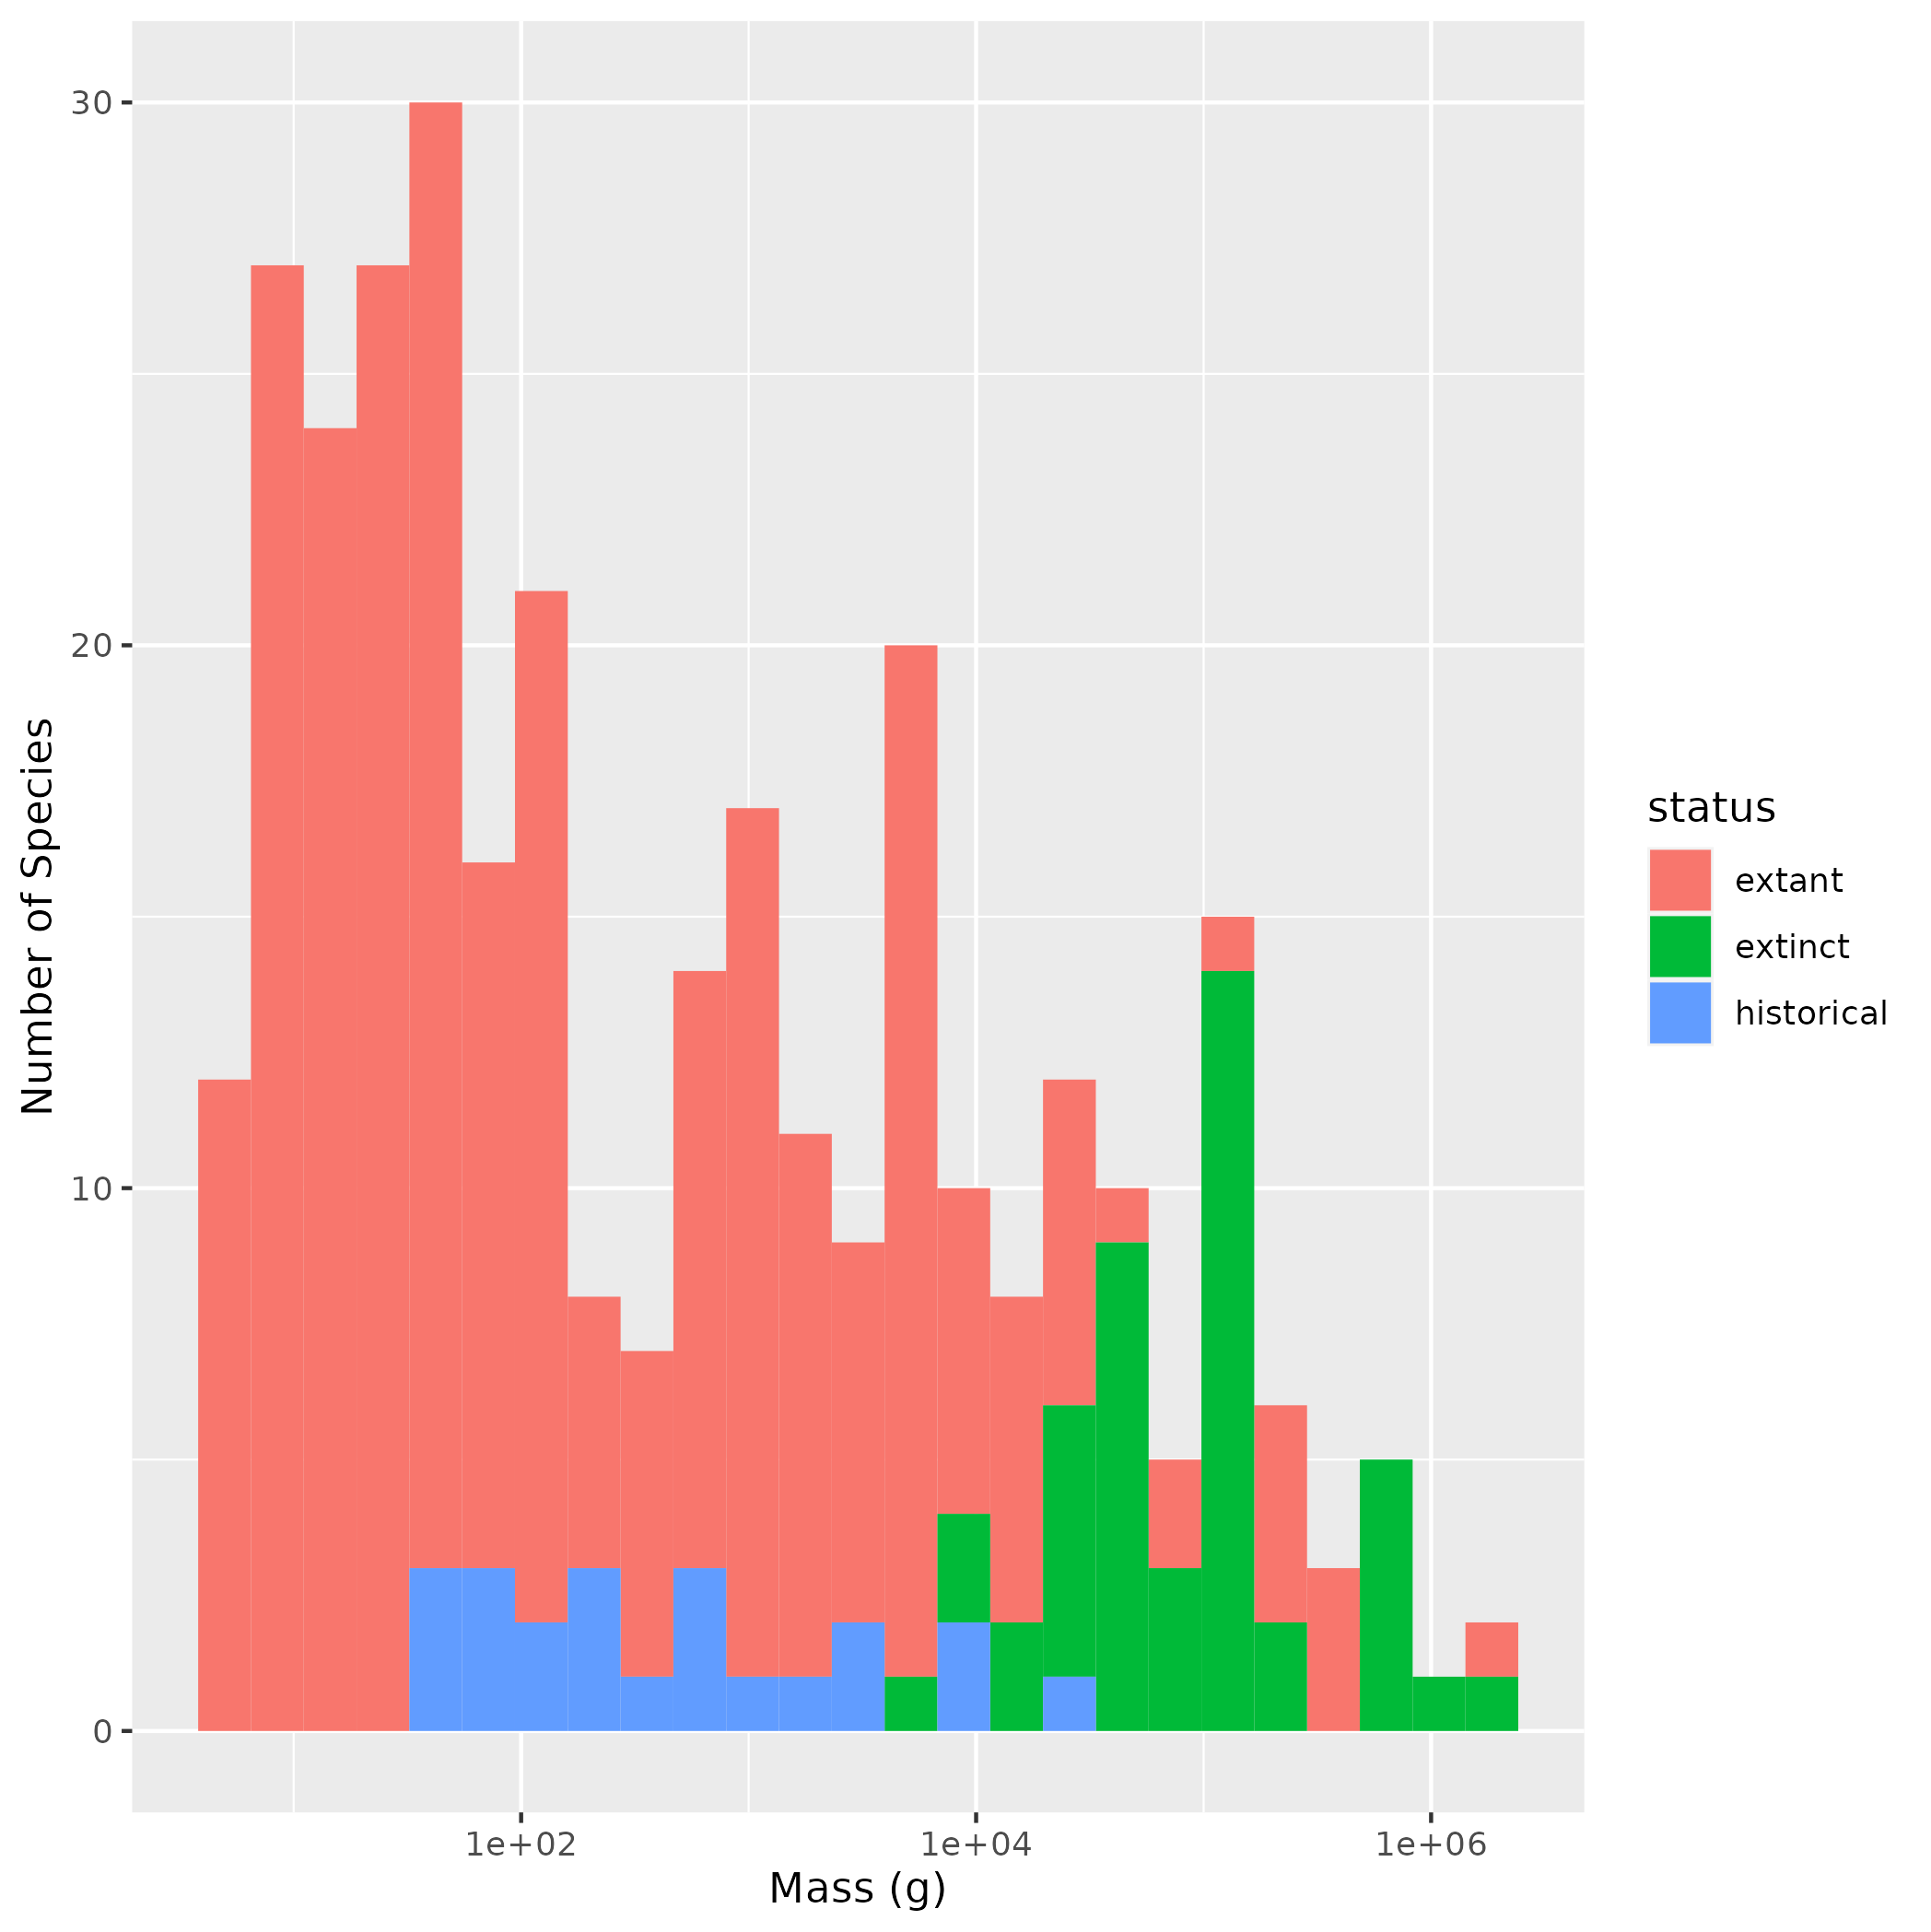
- The 3rd figure in the original paper explores Australia as a case study.
Australia is interesting because there is good data on both Pleistocene
extinctions (
extinctin thestatuscolumn) and more modern extinctions occurring over the last 300 years (historicalin thestatuscolumn). Make single stacked histogram that compares the sizes ofextinct,extant, andhistoricalstatuses. Scale the x-axis logarithmically and use 25 bins to roughly match the original figure. Use good axis labels. - (optional) Instead of excluding continent
EAby name in your analysis (in part 2), modify your code to determine from the data which continents had species that went extinct in the pleistocene and only include those continents.