Portal Data Review (dplyr)
If surveys.csv, species.csv, and plots.csv are not available in your workspace download them:
Load them into R using read.csv().
- Create a data frame with only data for the
species_idDO, with the columnsyear,month,day,species_id, andweight. - Create a data frame with only data for species IDs
PPandPBand for years starting in 1995, with the columnsyear,species_id, andhindfoot_length, with no null values forhindfoot_length. - Create a data frame with the average
hindfoot_lengthfor eachspecies_idin eachyearwith no null values. - Create a data frame with the
year,genus,species,weightandplot_typefor all cases where thegenusis"Dipodomys". - Make a scatter plot with
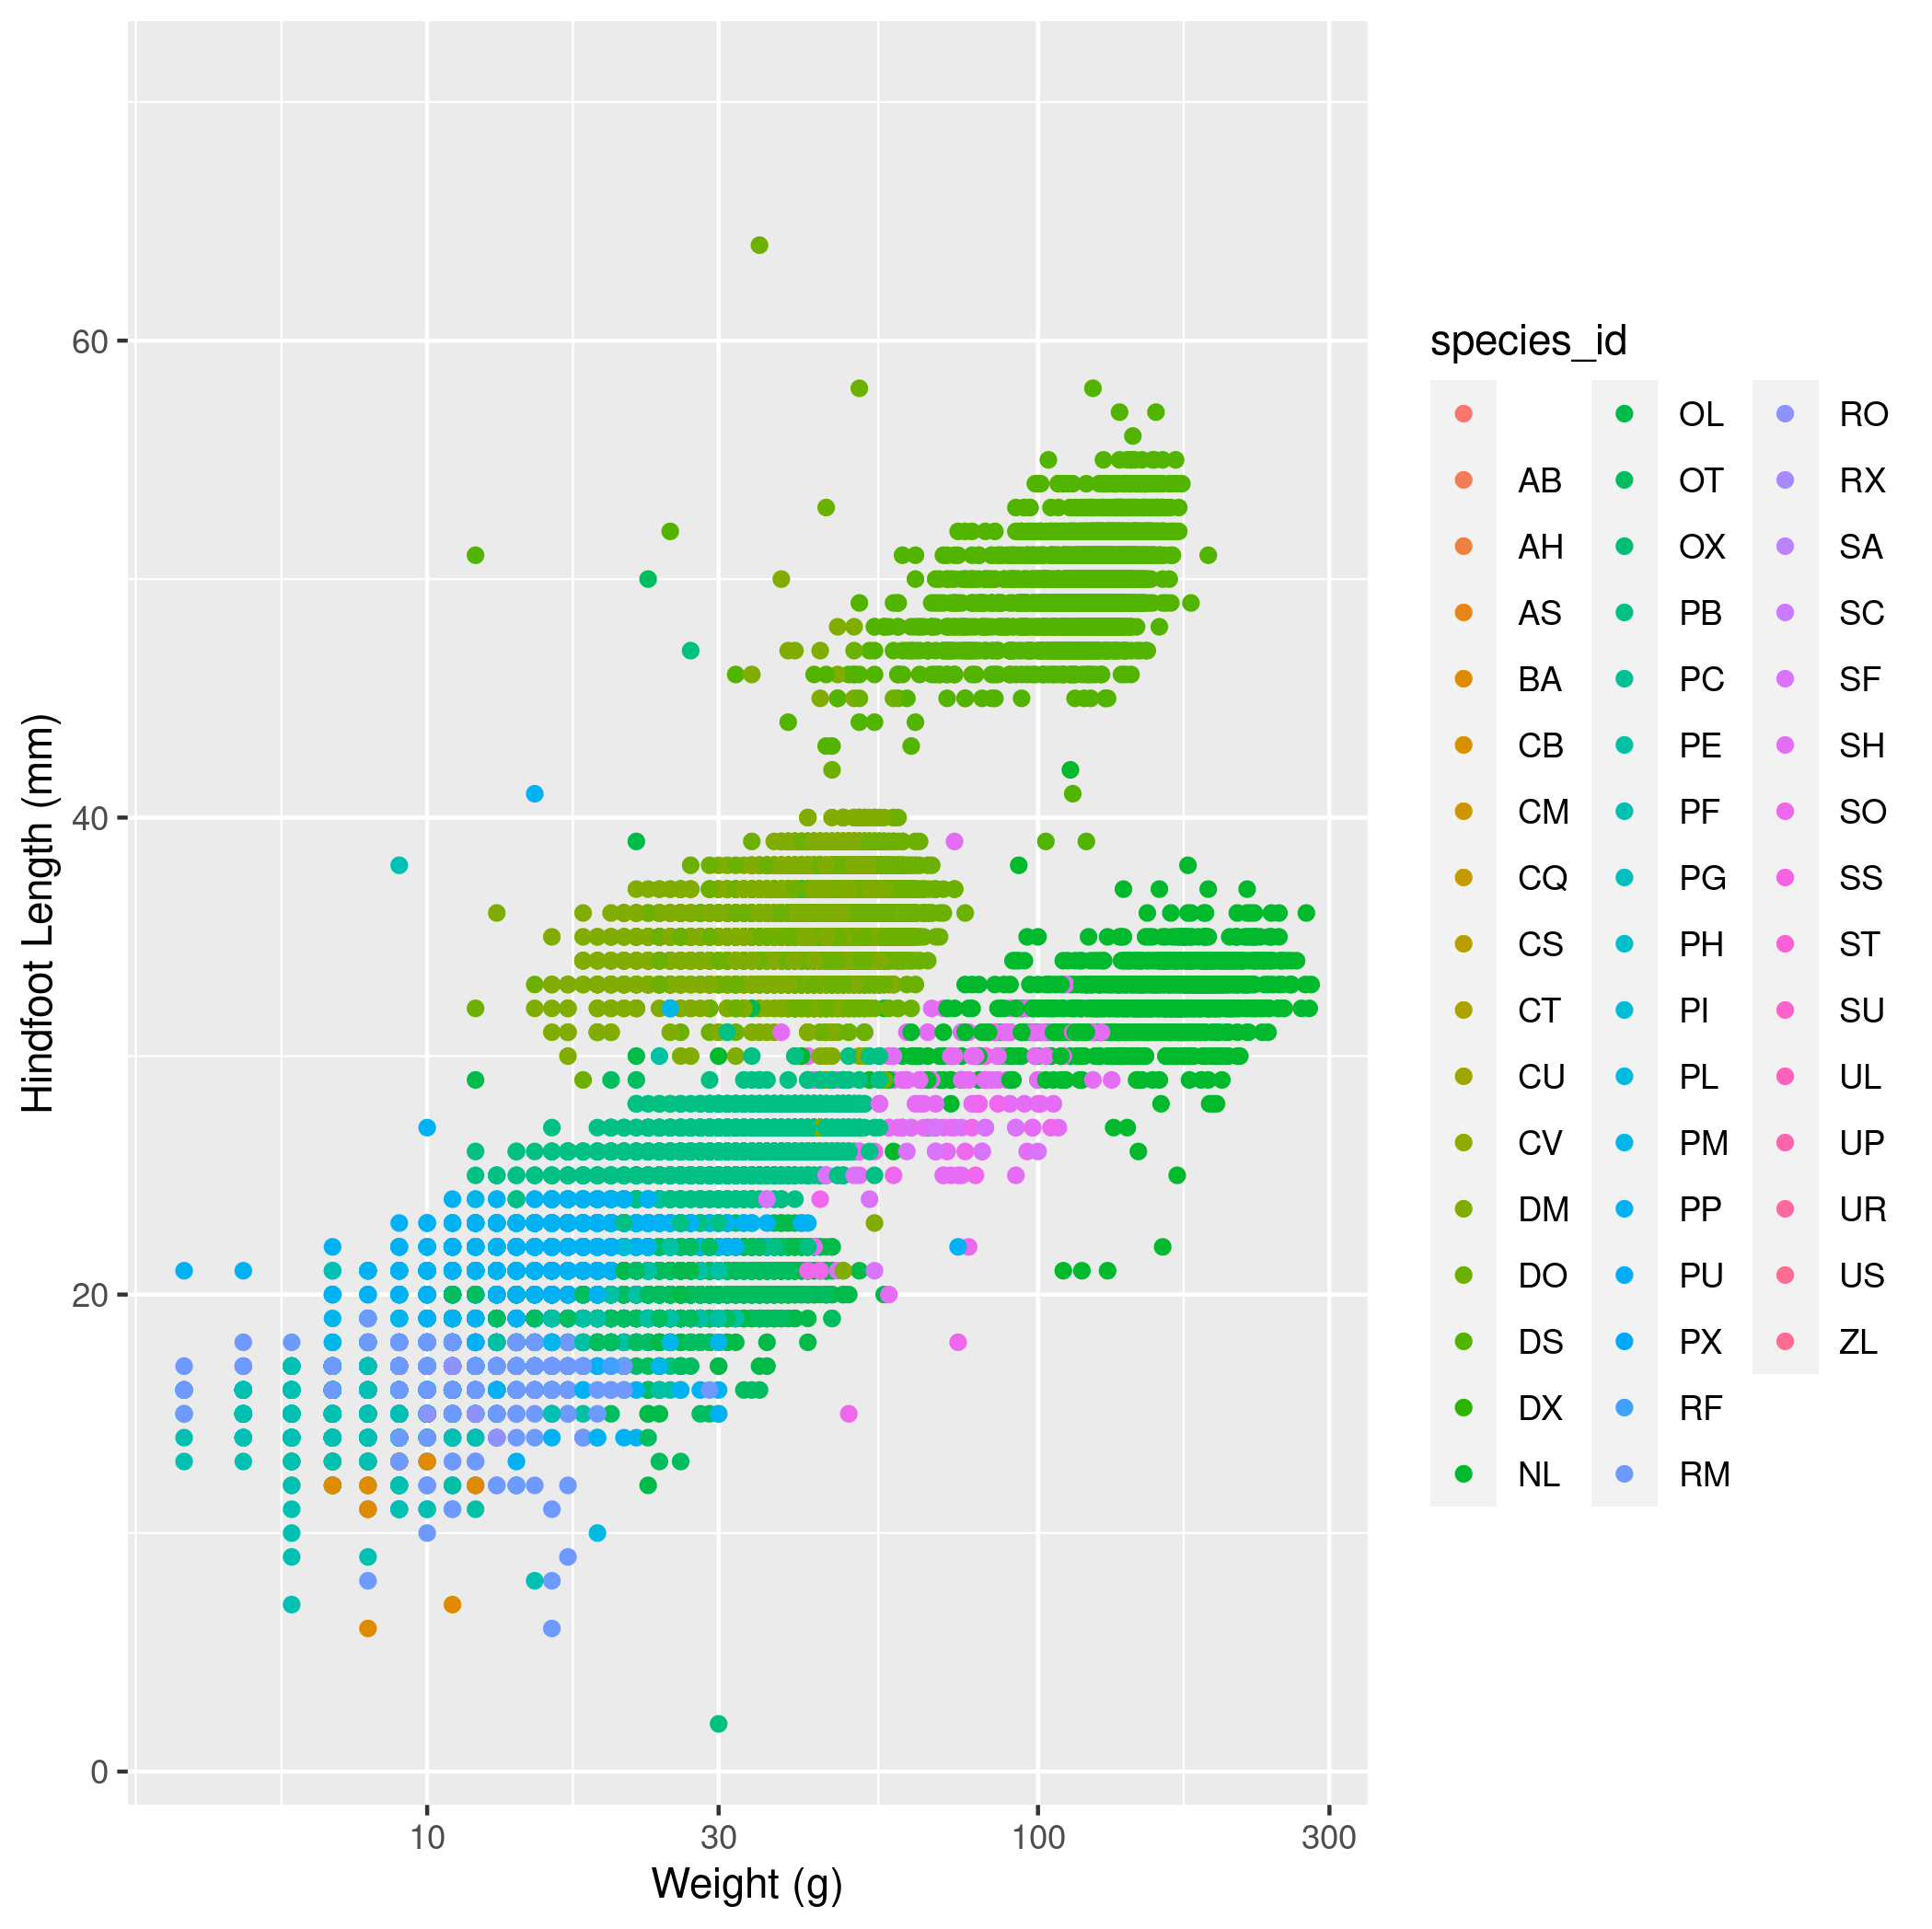
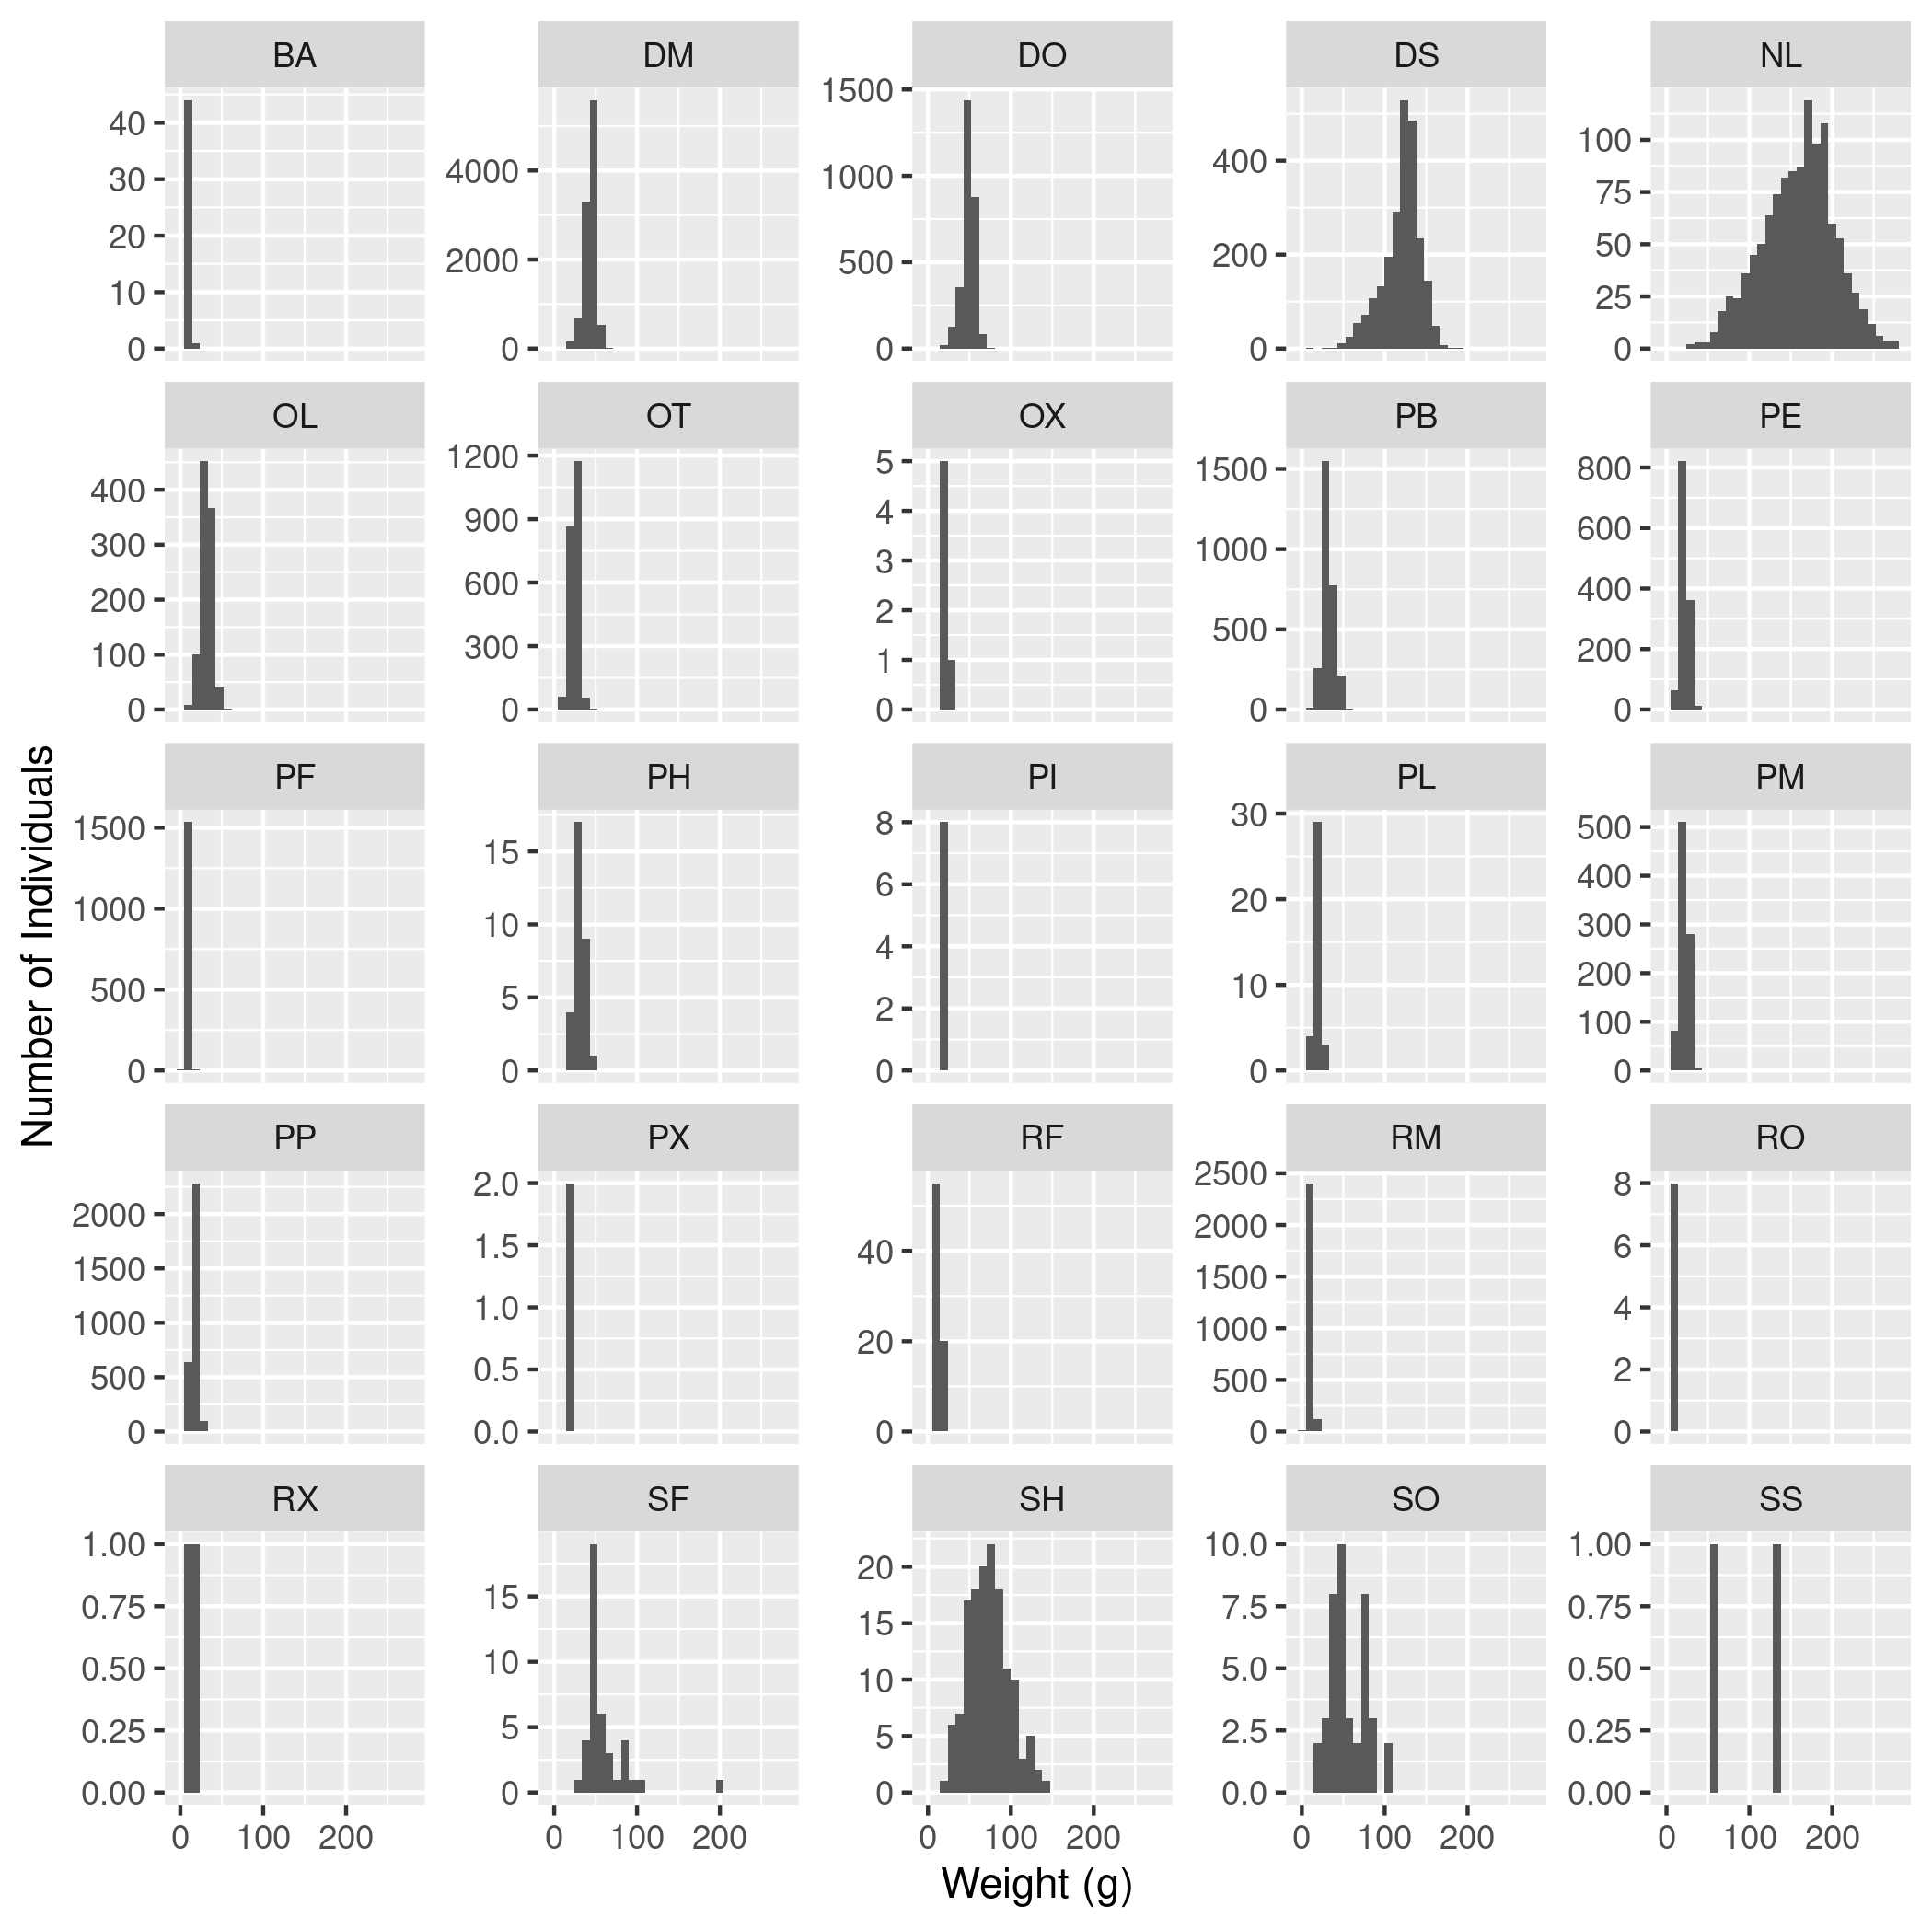
weighton the x-axis andhindfoot_lengthon the y-axis. Use alog10scale on the x-axis. Color the points byspecies_id. Include good axis labels. - Make a histogram of weights with a separate subplot for each
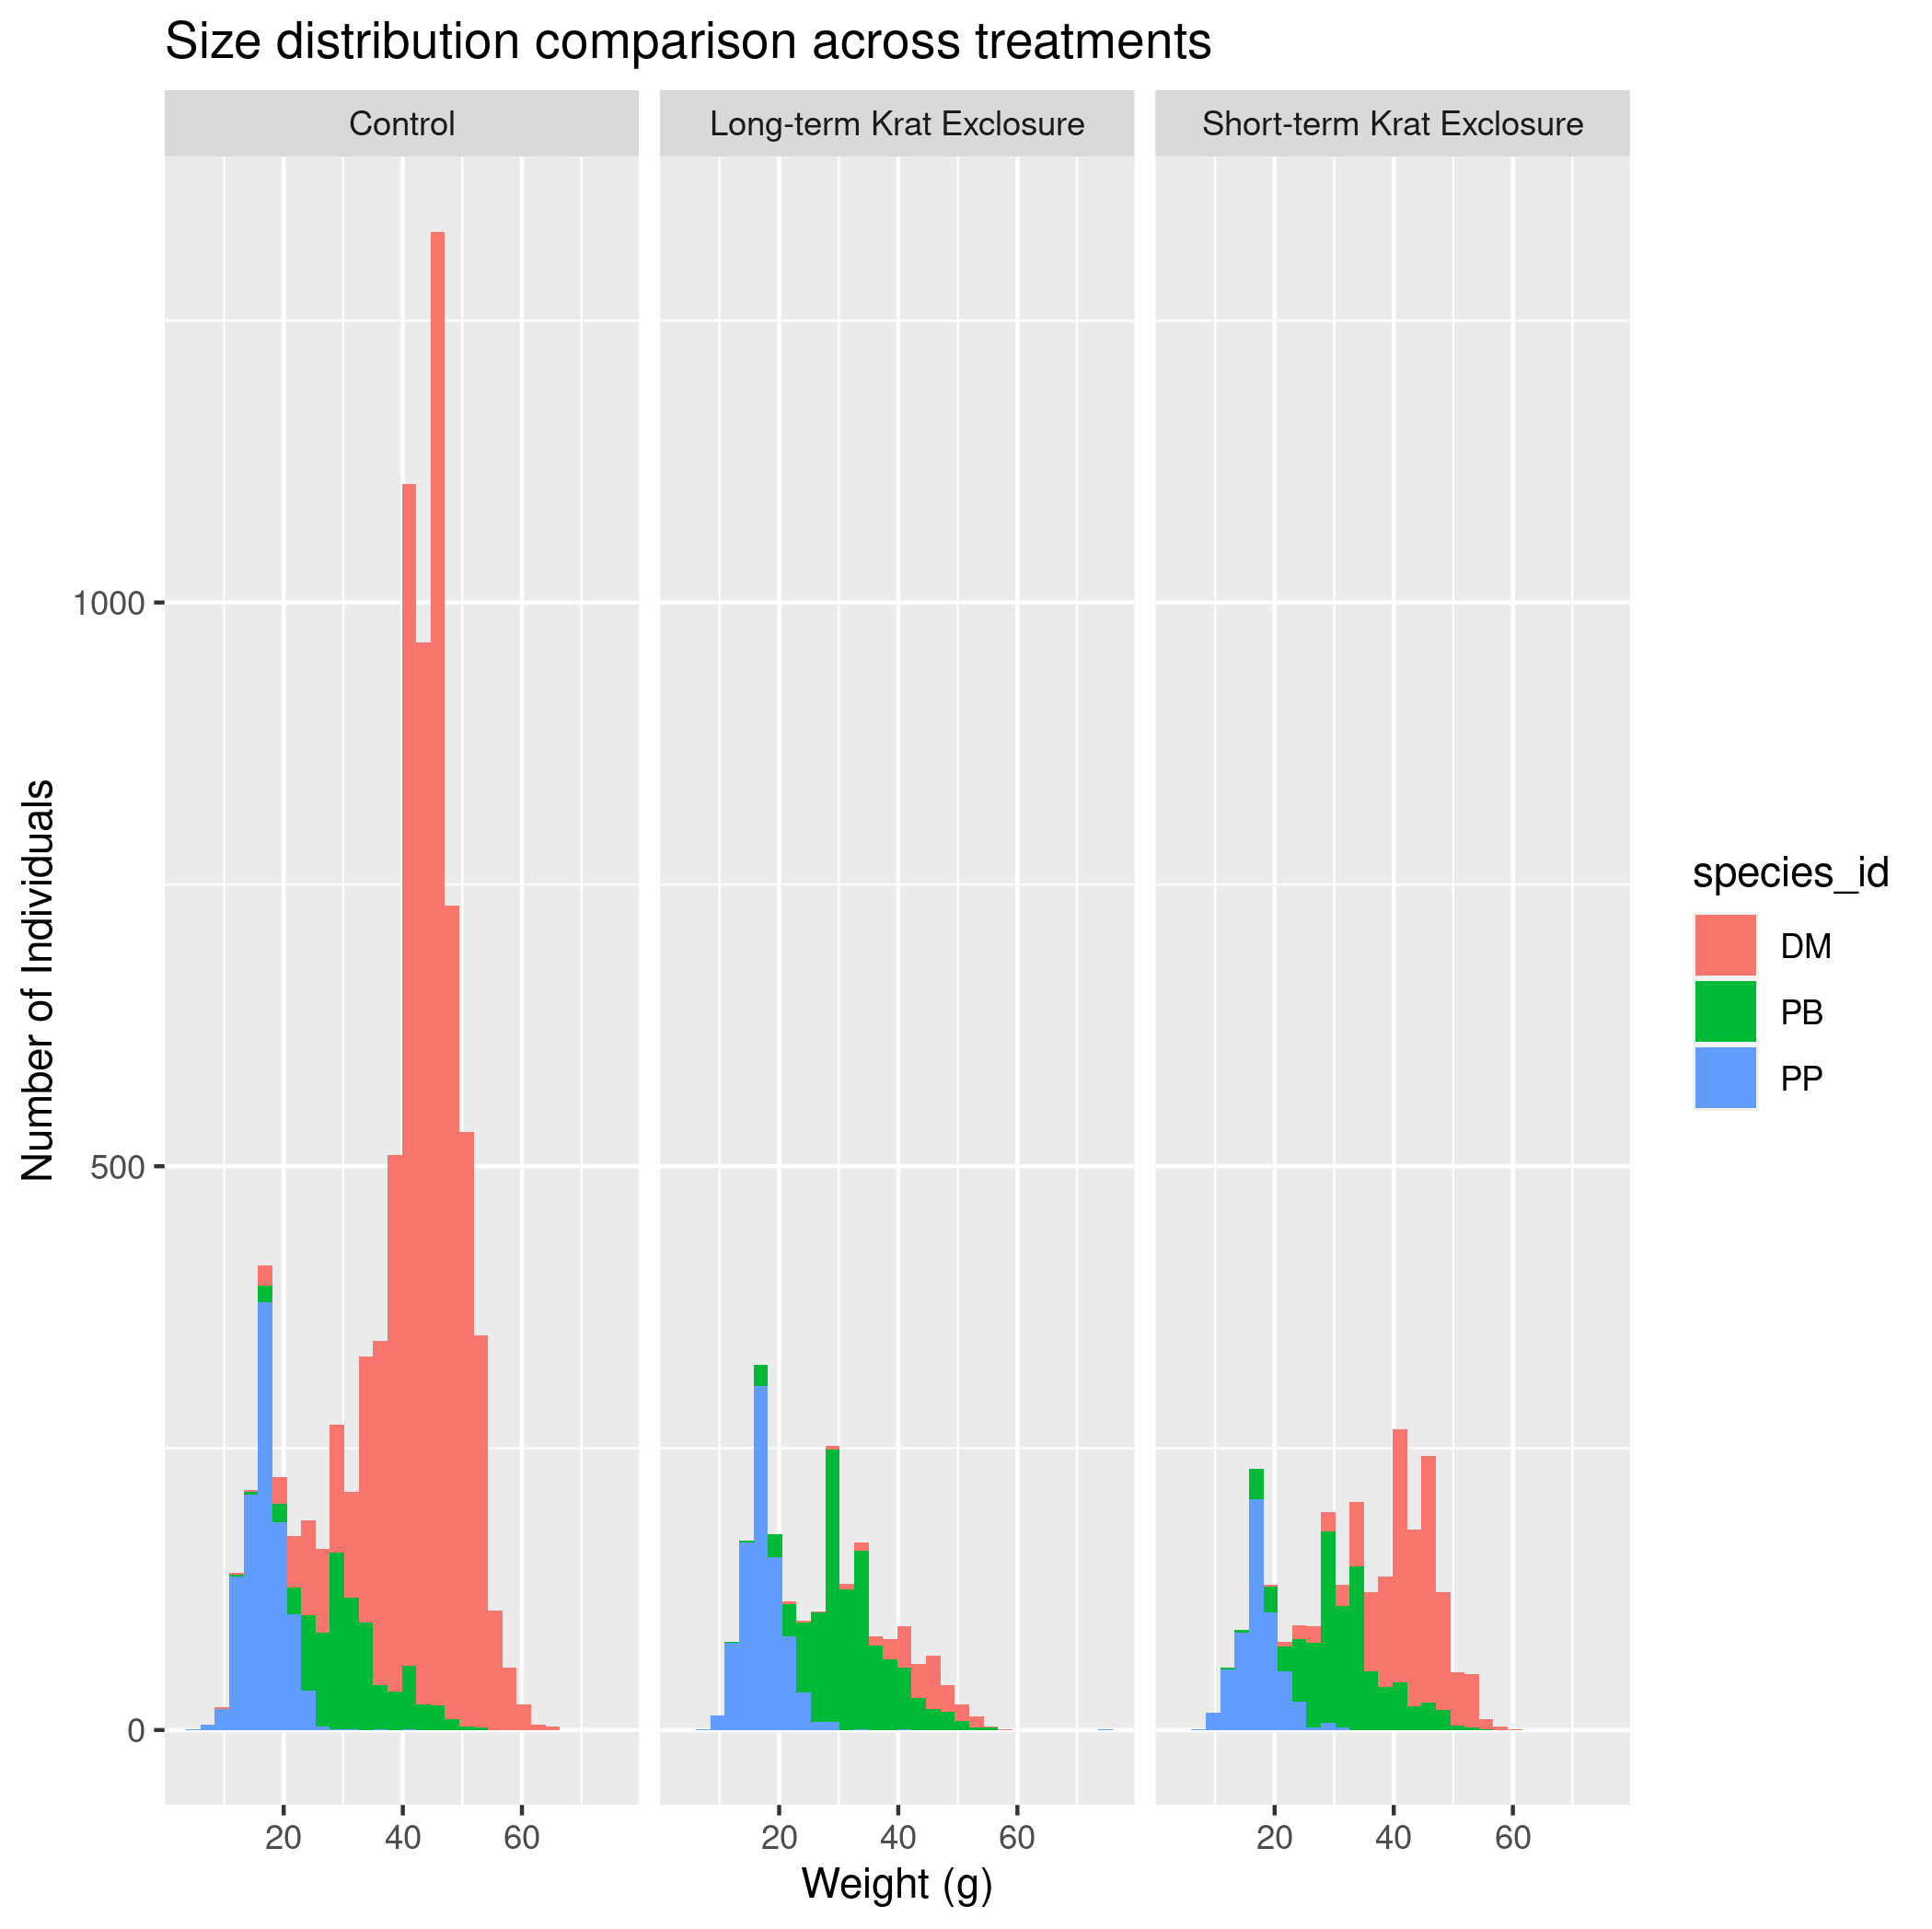
species_id. Do not include species with no weights. Set thescalesargument to"free_y"so that the y-axes can vary. Include good axis labels. - (Challenge) Make a plot with histograms of the weights of three species,
PP,PB, andDM, colored byspecies_id, with a different facet (i.e., subplot) for each of threeplot_type’sControl,Long-term Krat Exclosure, andShort-term Krat Exclosure. Include good axis labels and a title for the plot. Export the plot to apngfile.