Writing Tidyverse Functions (Functions)
1. Copy the following vectors into R and combine them into a data frame named count_data with columns named state, count, area, and site.
state_vector <- c("FL", "FL", "FL", "FL", "GA", "GA", "GA", "GA", "SC", "SC", "SC", "SC")
site_vector <- c("A", "B", "C", "D", "A", "B", "C", "D", "A", "B", "C", "D")
count_vector <- c(9, 16, 3, 10, 2, 26, 5, 8, 17, 8, 2, 6)
area_vector <- c(3, 5, 1.9, 2.7, 2, 2.6, 6.2, 4.5, 8, 4, 1, 3)
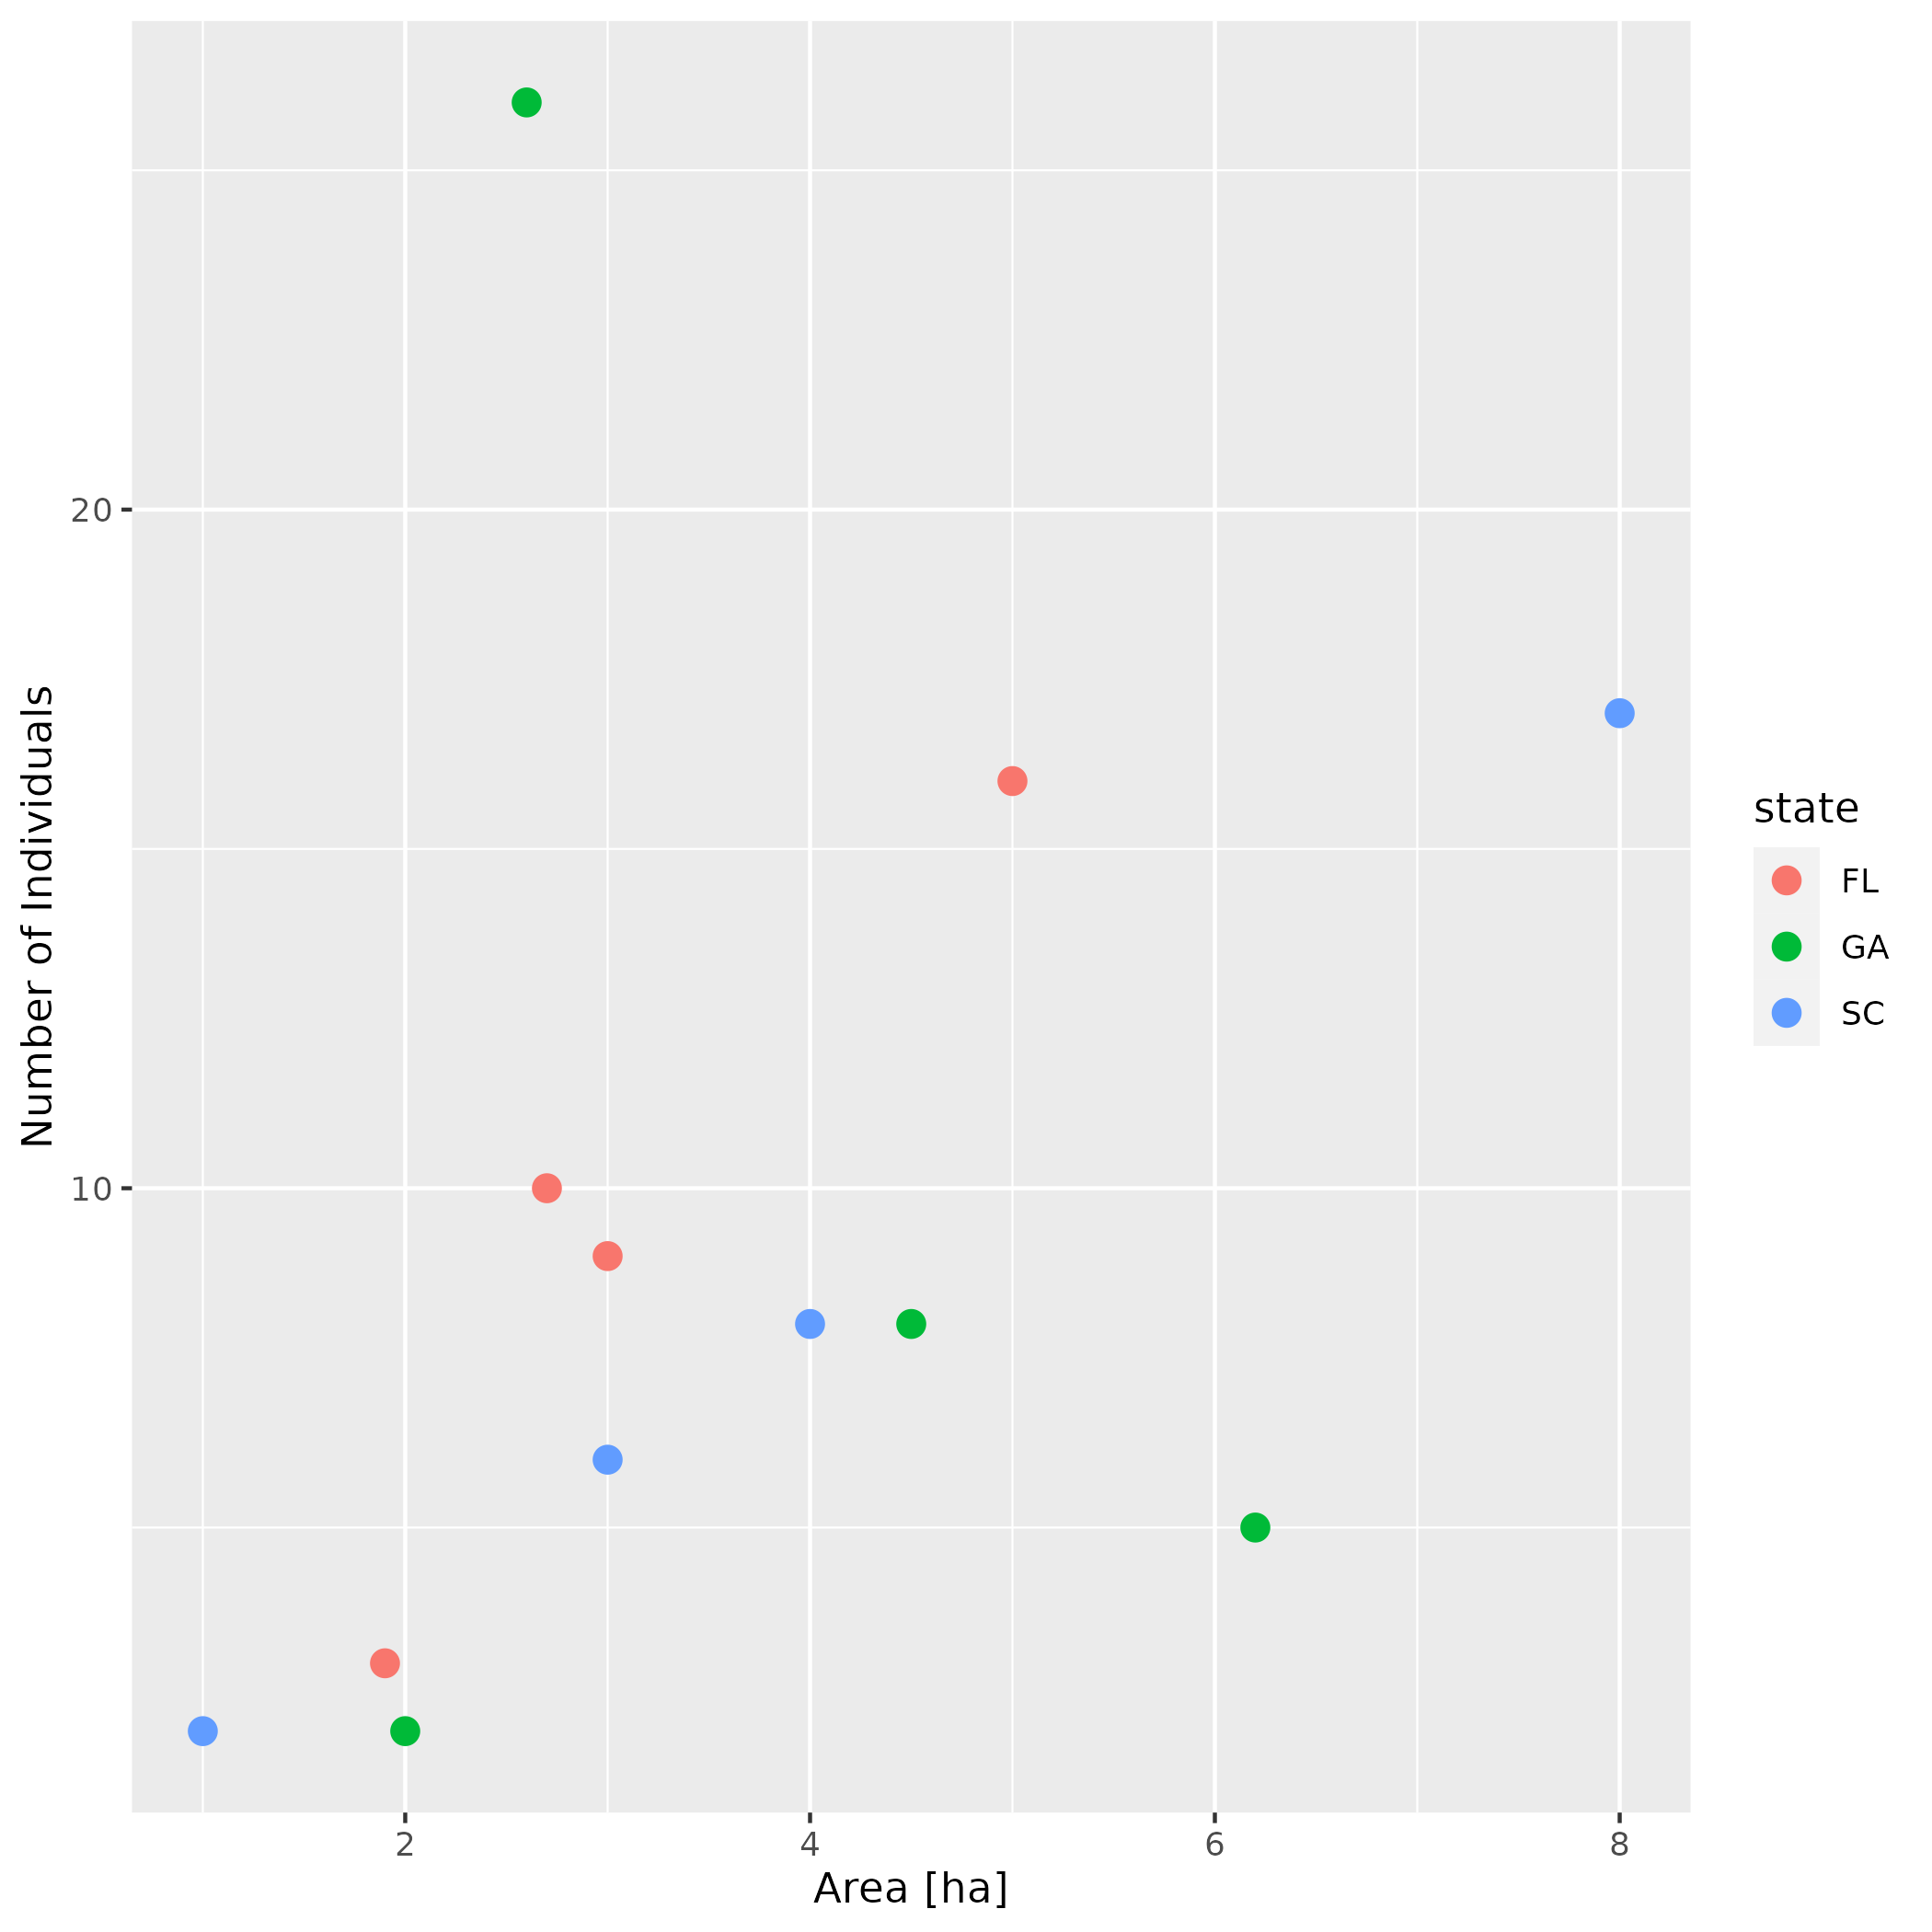
2. Write a function takes takes two arguments: 1) a data frame with a count column and an area column; and 2) a column in that data frame to color the points by. Have the function make a plot with area on the x-axis and count on the y-axis and the points colored by the column you provided as an argument. Set the size of the points to 3. Use the function to make a scatter plot of count as a function of area for the count_data data frame with the points colored by the state column.
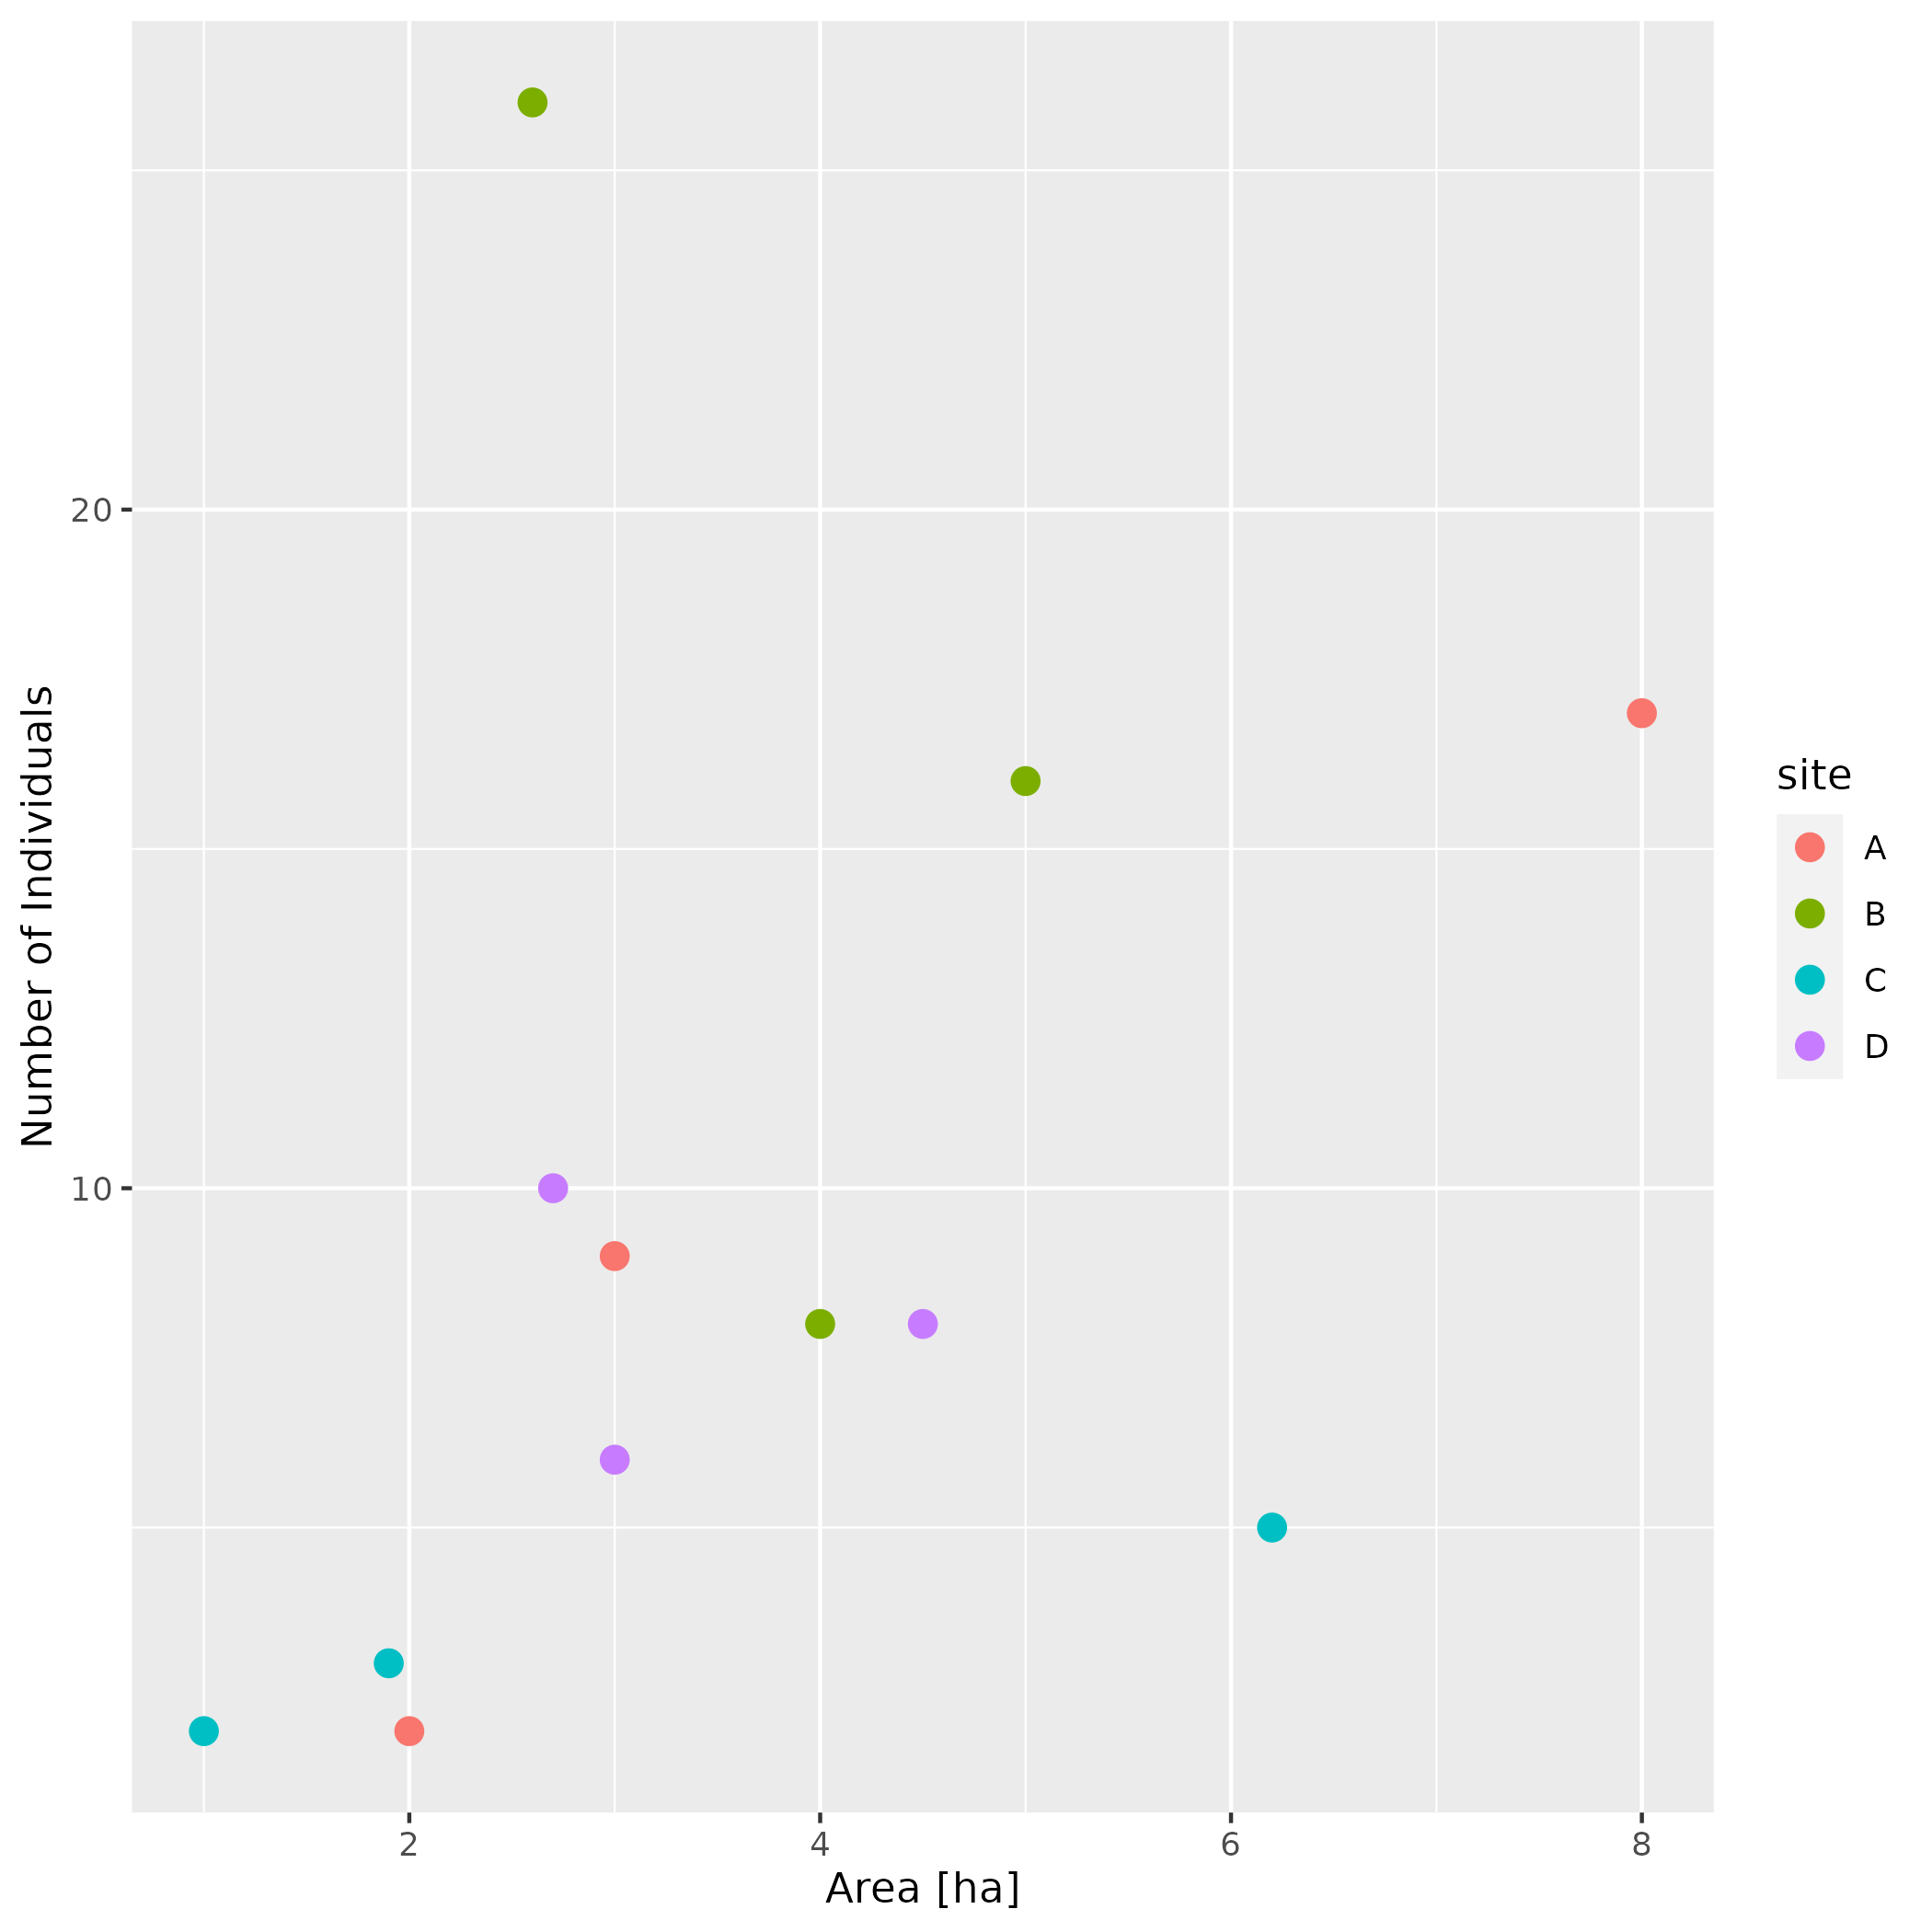
3. Use the function from (2) to make a scatter plot of count as a function of area for the count_data data frame with the points colored by the site column.