Learning Objectives
Following this assignment students should be able to:
- practice basic syntax and usage of
forloops- use
forloops to automate function operations- understand how to decompose complex problems
Reading
-
Topics
- Iteration
- Problem decomposition
-
Readings
Lecture Notes
Place this code at the start of the assignment to load all the required packages.
library(dplyr)
library(ggplot2)
Exercises
Basic For Loops (30 pts)
1. The code below prints the numbers 1 through 5 one line at a time. Modify it to print each of these numbers multiplied by 3.
numbers <- c(1, 2, 3, 4, 5)
for (number in numbers){
  print(number)
}
2. Write a for loop that loops over the following vector and prints out the mass in kilograms (
mass_kg = 2.2 * mass_lb)mass_lbs <- c(2.2, 3.5, 9.6, 1.2)3. Complete the code below so that it prints out the name of each bird one line at a time.
birds = c('robin', 'woodpecker', 'blue jay', 'sparrow')
for (i in 1:length(_________)){
  print(birds[__])
}
4. Complete the code below so that it stores one area for each radius.
radius <- c(1.3, 2.1, 3.5)
areas <- vector(_____ = "numeric", length = ______)
for (__ in 1:length(________)){
  areas[__] <- pi * radius[i] ^ 2
}
areas
5. Complete the code below to calculate an area for each pair of
lengthsandwidths, store the areas in a vector, and after they are all calculated print them out:Expected outputs for Basic For Loops: 1lengths = c(1.1, 2.2, 1.6) widths = c(3.5, 2.4, 2.8) areas <- vector(length = __________) for (i in _____) { areas[__] <- lengths[__] * widths[__] } areasSize Estimates By Name Loop (30 pts)
This is a followup to Size Estimates by Name.
If
dinosaur_lengths.csvis not already in your working directory download a copy of the data on dinosaur lengths with species names. Load it into R.Write a function
mass_from_length()that uses the equationmass <- a * length^bto estimate the size of a dinosaur from its length. This function should take two arguments,lengthandspecies. For each of the following inputs forspecies, so use the associatedaandbvalues to estimate the species mass using these equations:- Stegosauria:
mass = 10.95 * length ^ 2.64(Seebacher 2001). - Theropoda:
mass = 0.73 * length ^ 3.63(Seebacher 2001). - Sauropoda:
mass = 214.44 * length ^ 1.46(Seebacher 2001). - For any other value of
species:mass = 25.37 * length ^ 2.49
- Use this function and a for loop to calculate the estimated mass for each dinosaur, store the masses in a vector, and after all of the calculations are complete show the first few items in the vector using
head(). - Add the results in the vector back to the original data frame. Show the first few rows of the data frame using
head(). - Calculate the mean mass for each
speciesusingdplyr.
- Stegosauria:
Multi-file Analysis (40 pts)
You have a satellite collars on a number of different individuals and want to be able to quickly look at all of their recent movements at once. The data is posted daily to a url as a zip file that contains one csv file for each individual: http://www.datacarpentry.org/semester-biology/data/individual_collar_data.zip Start your solution by:
- If
individual_collar_data.zipis not already in your working directory download the zip file usingdownload.file() - Unzip it using
unzip() - Obtain a list of all of the files with file names matching the pattern
"collar-data-.*.txt"(usinglist.files())
-
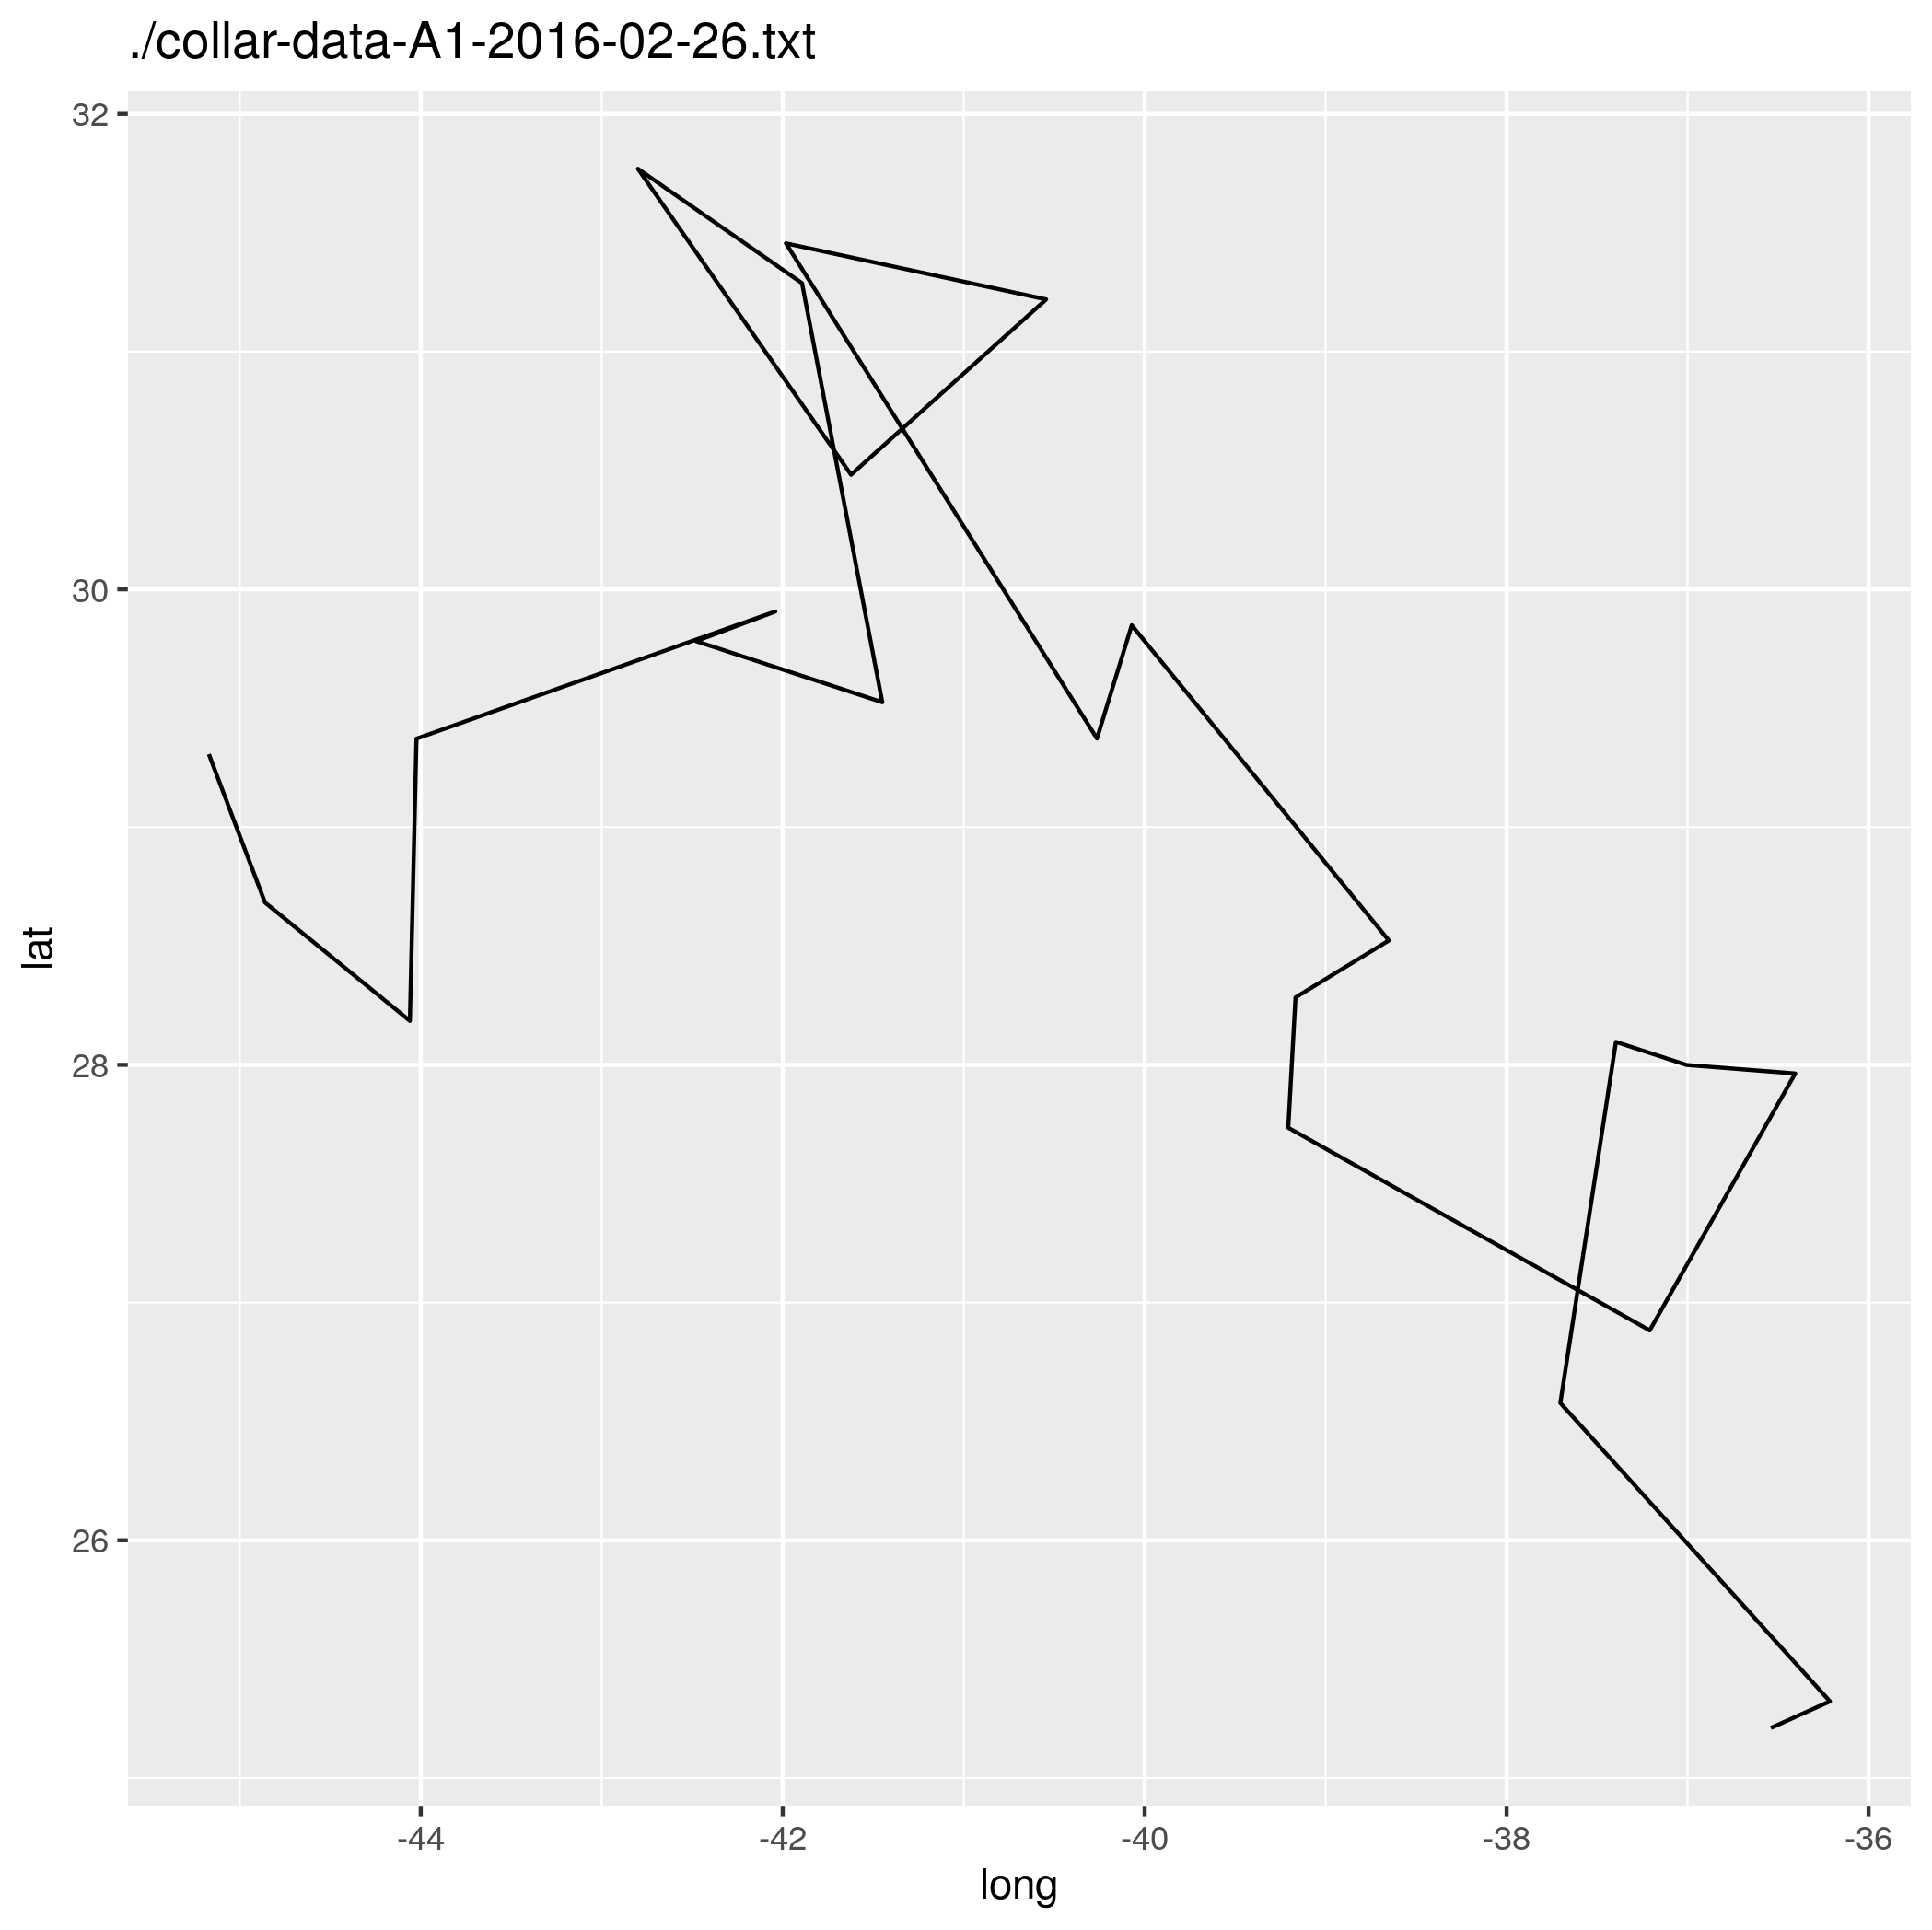
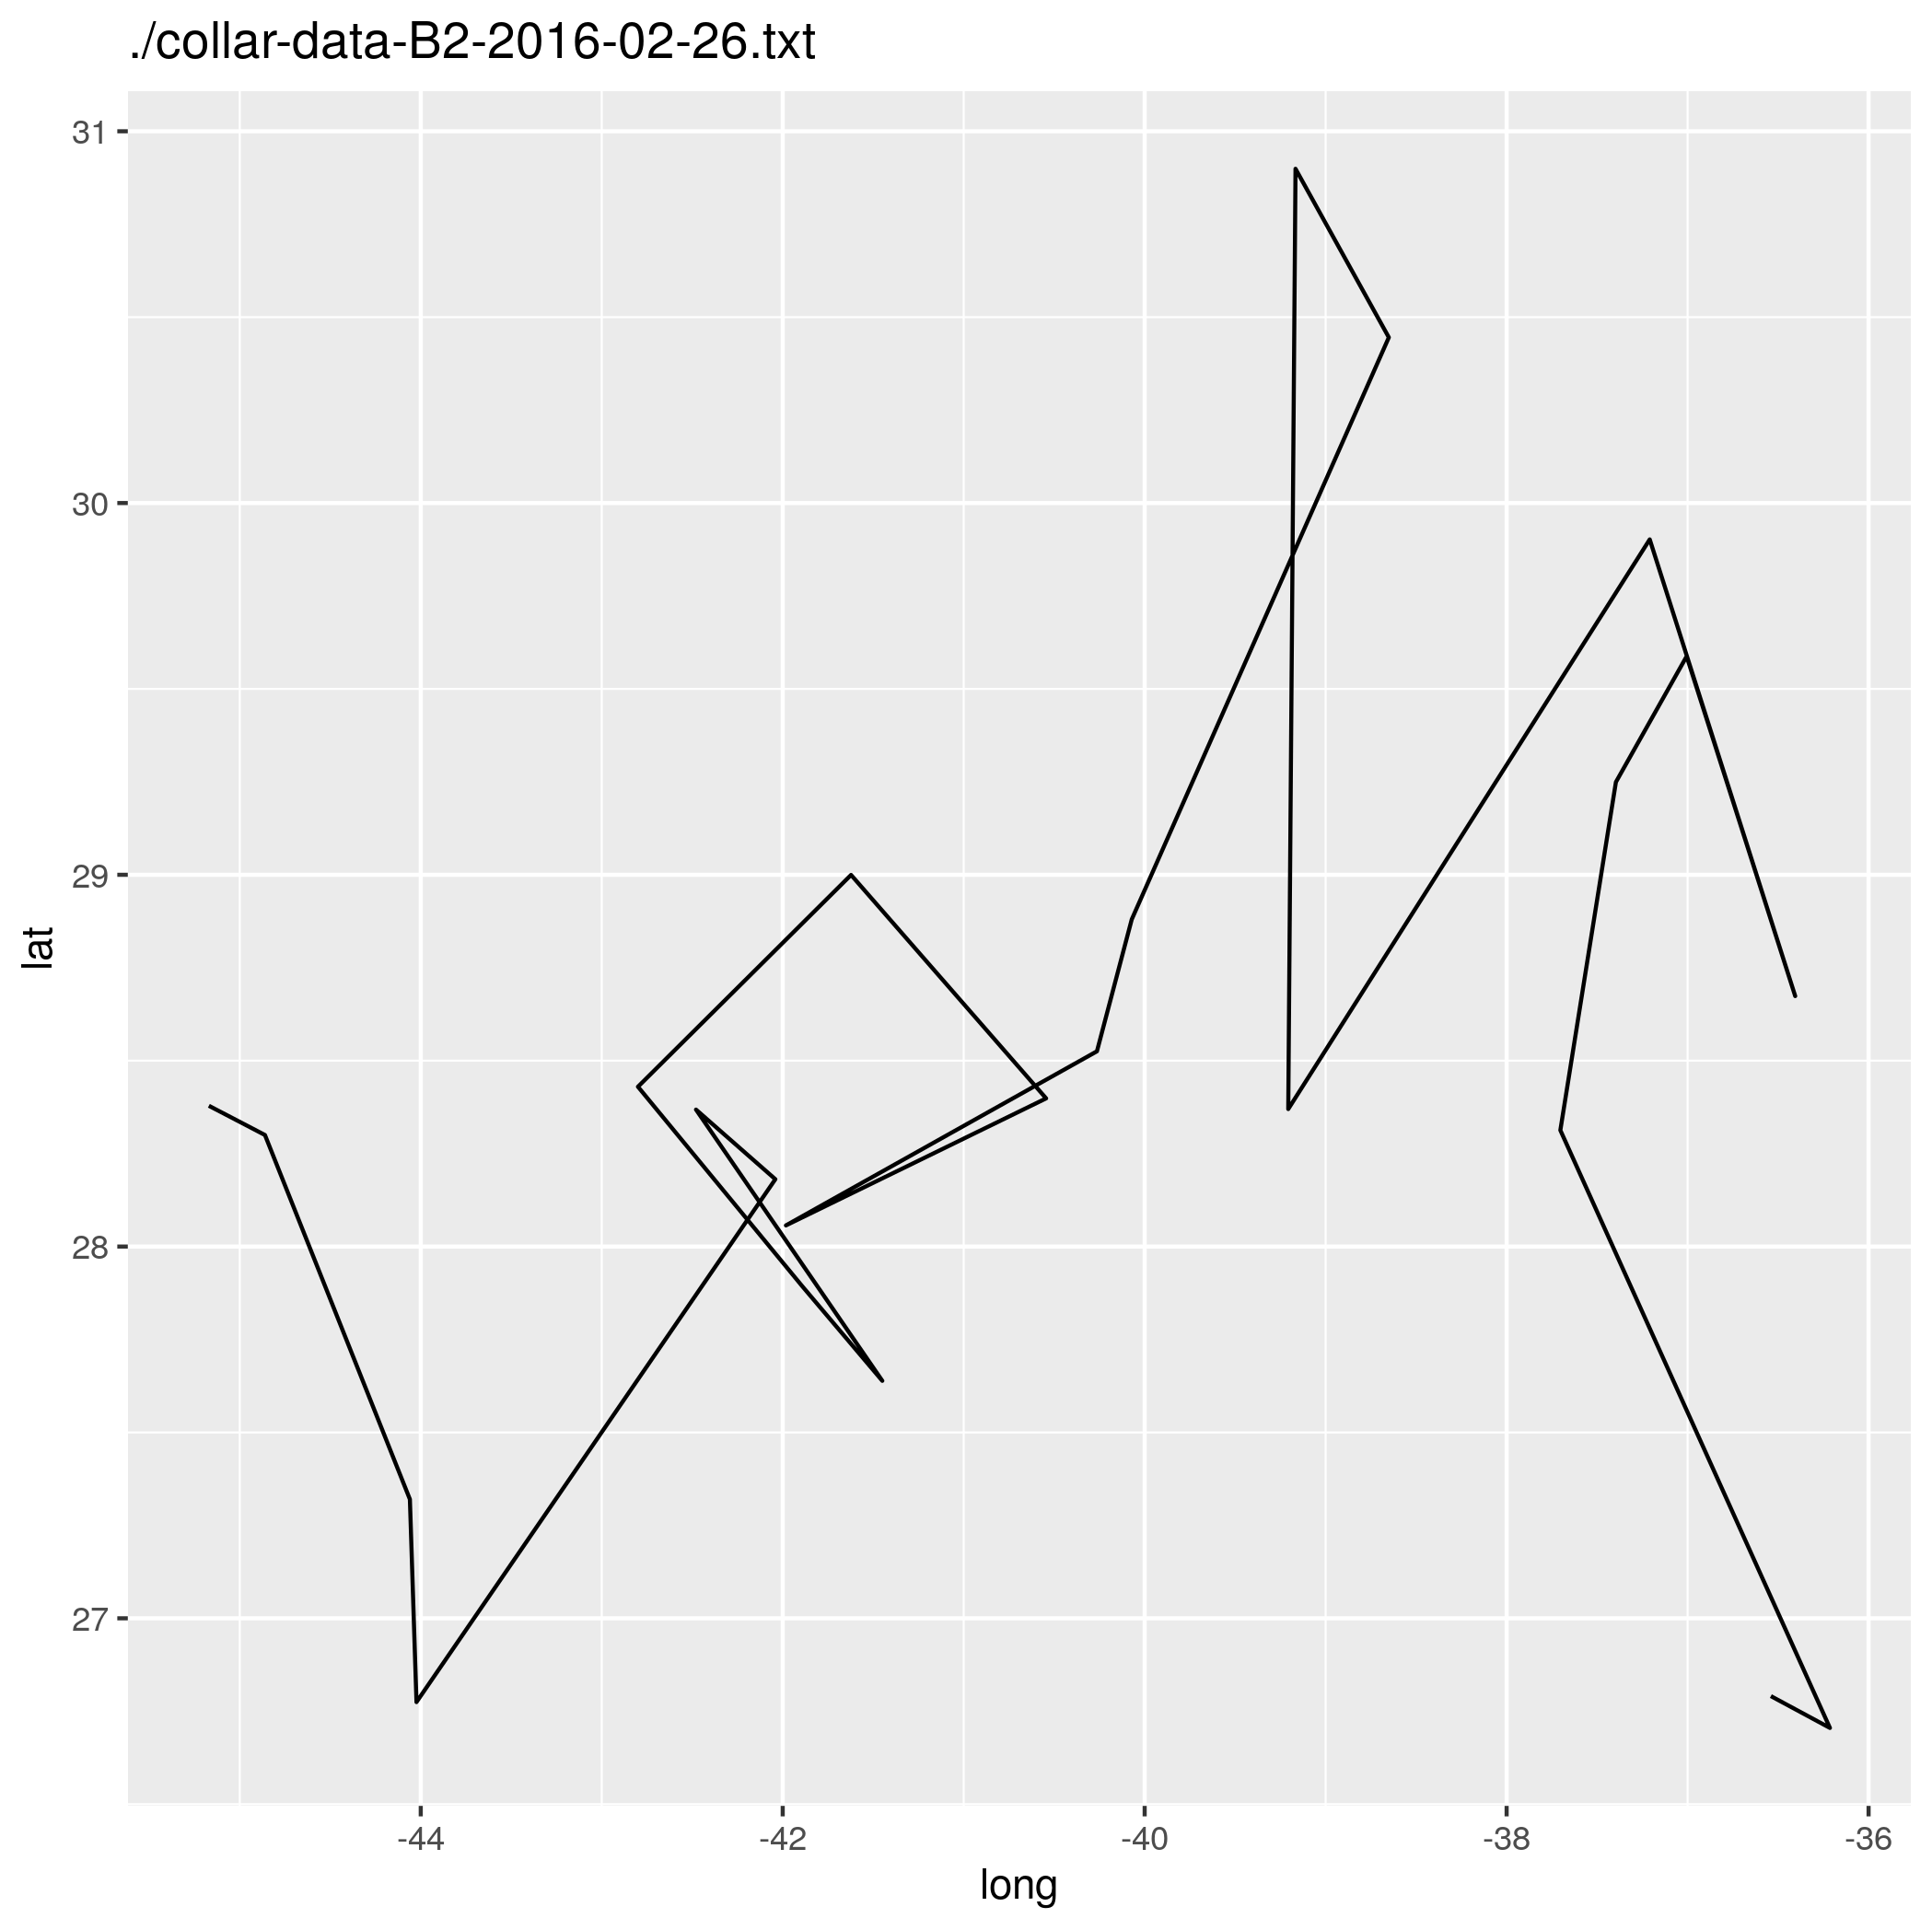
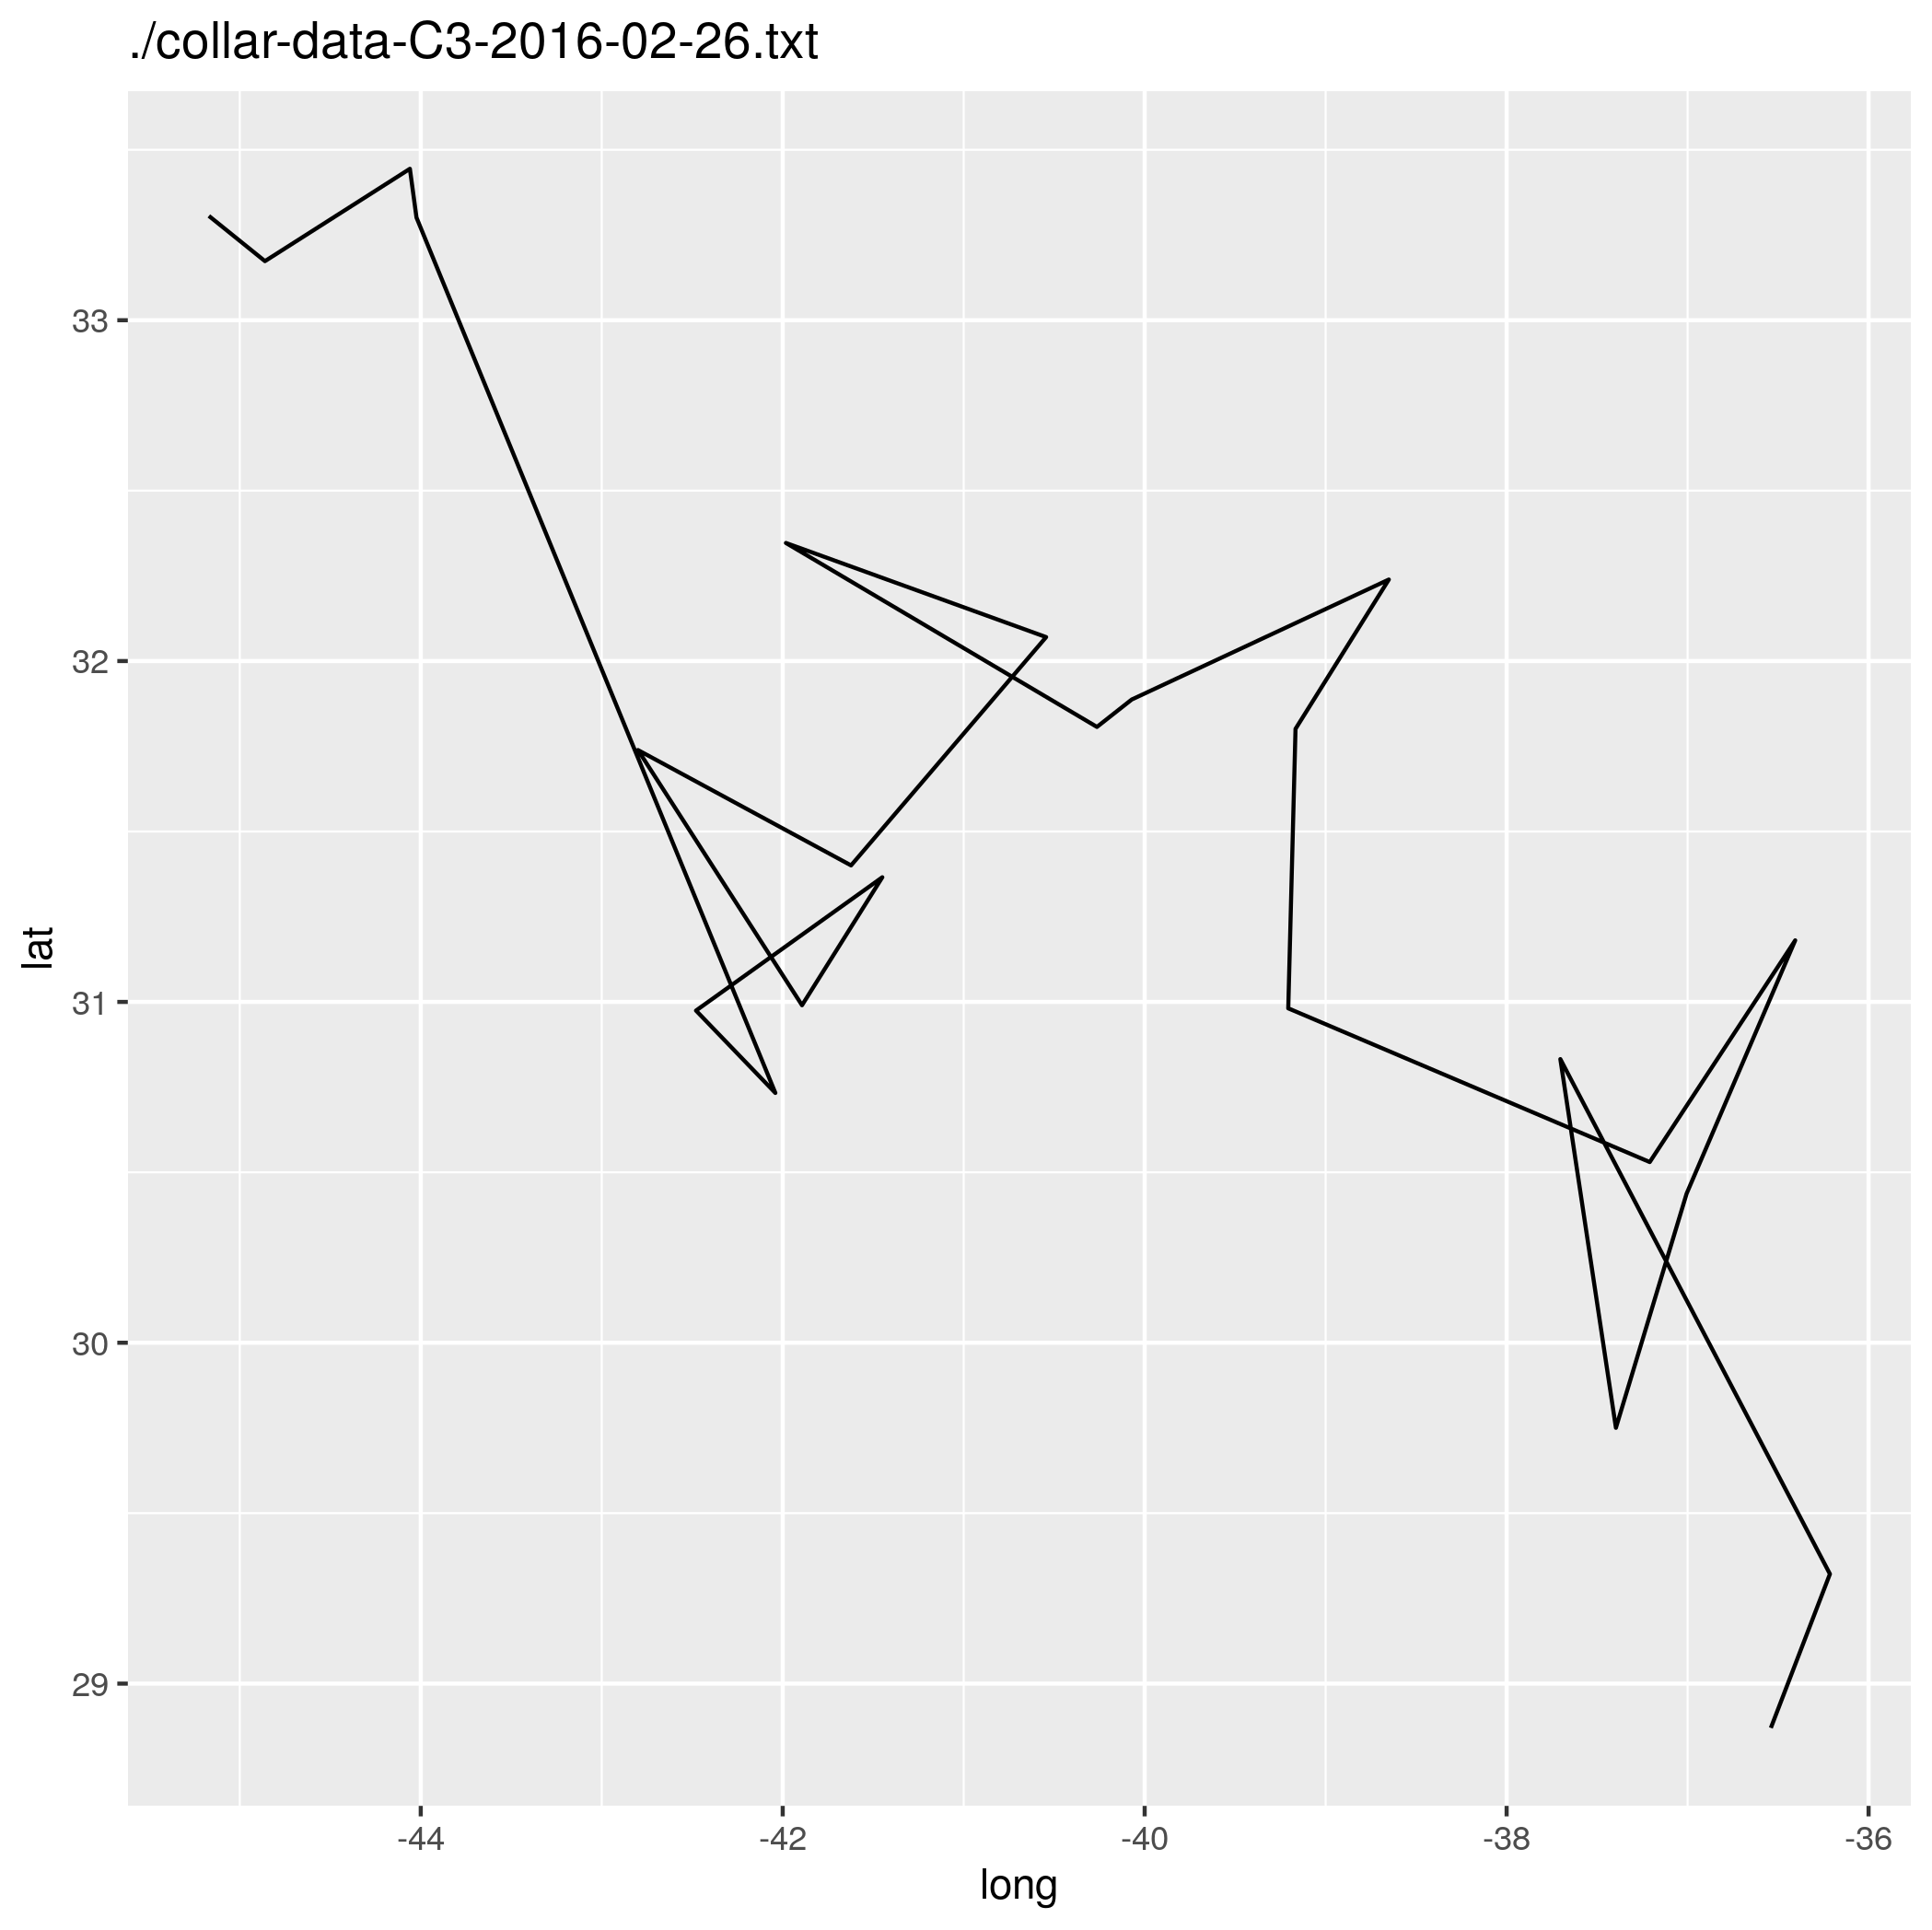
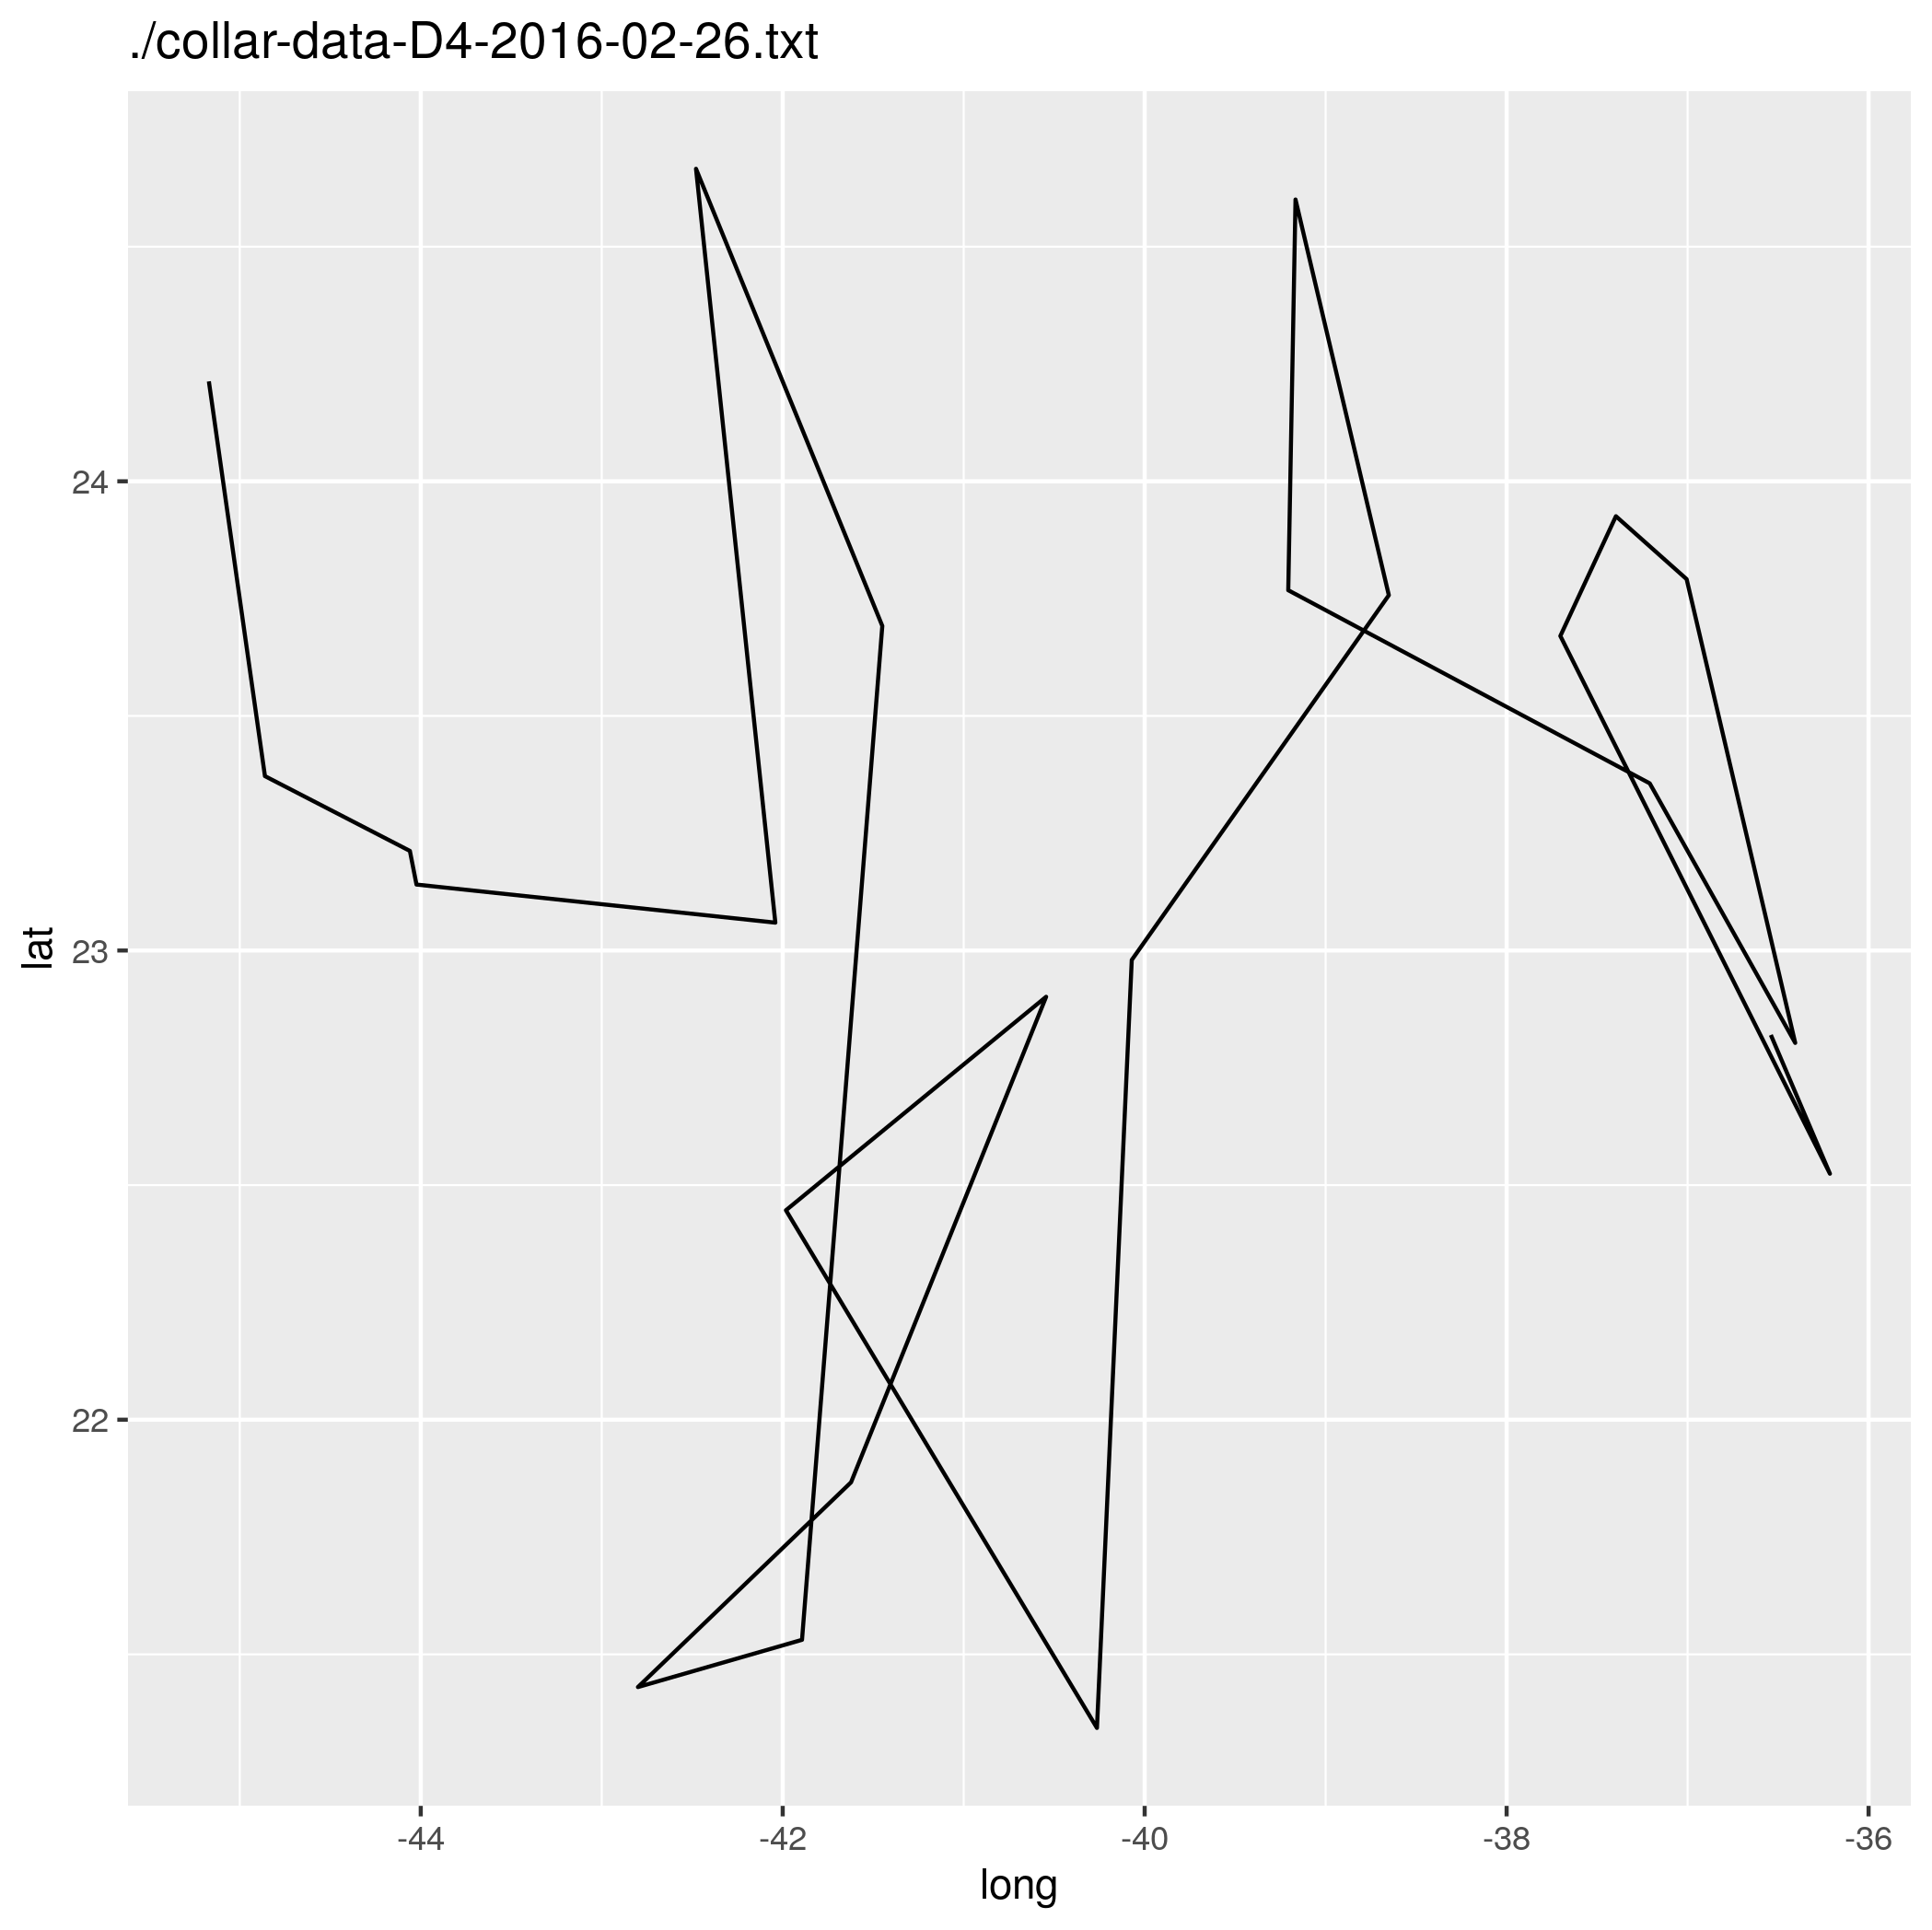
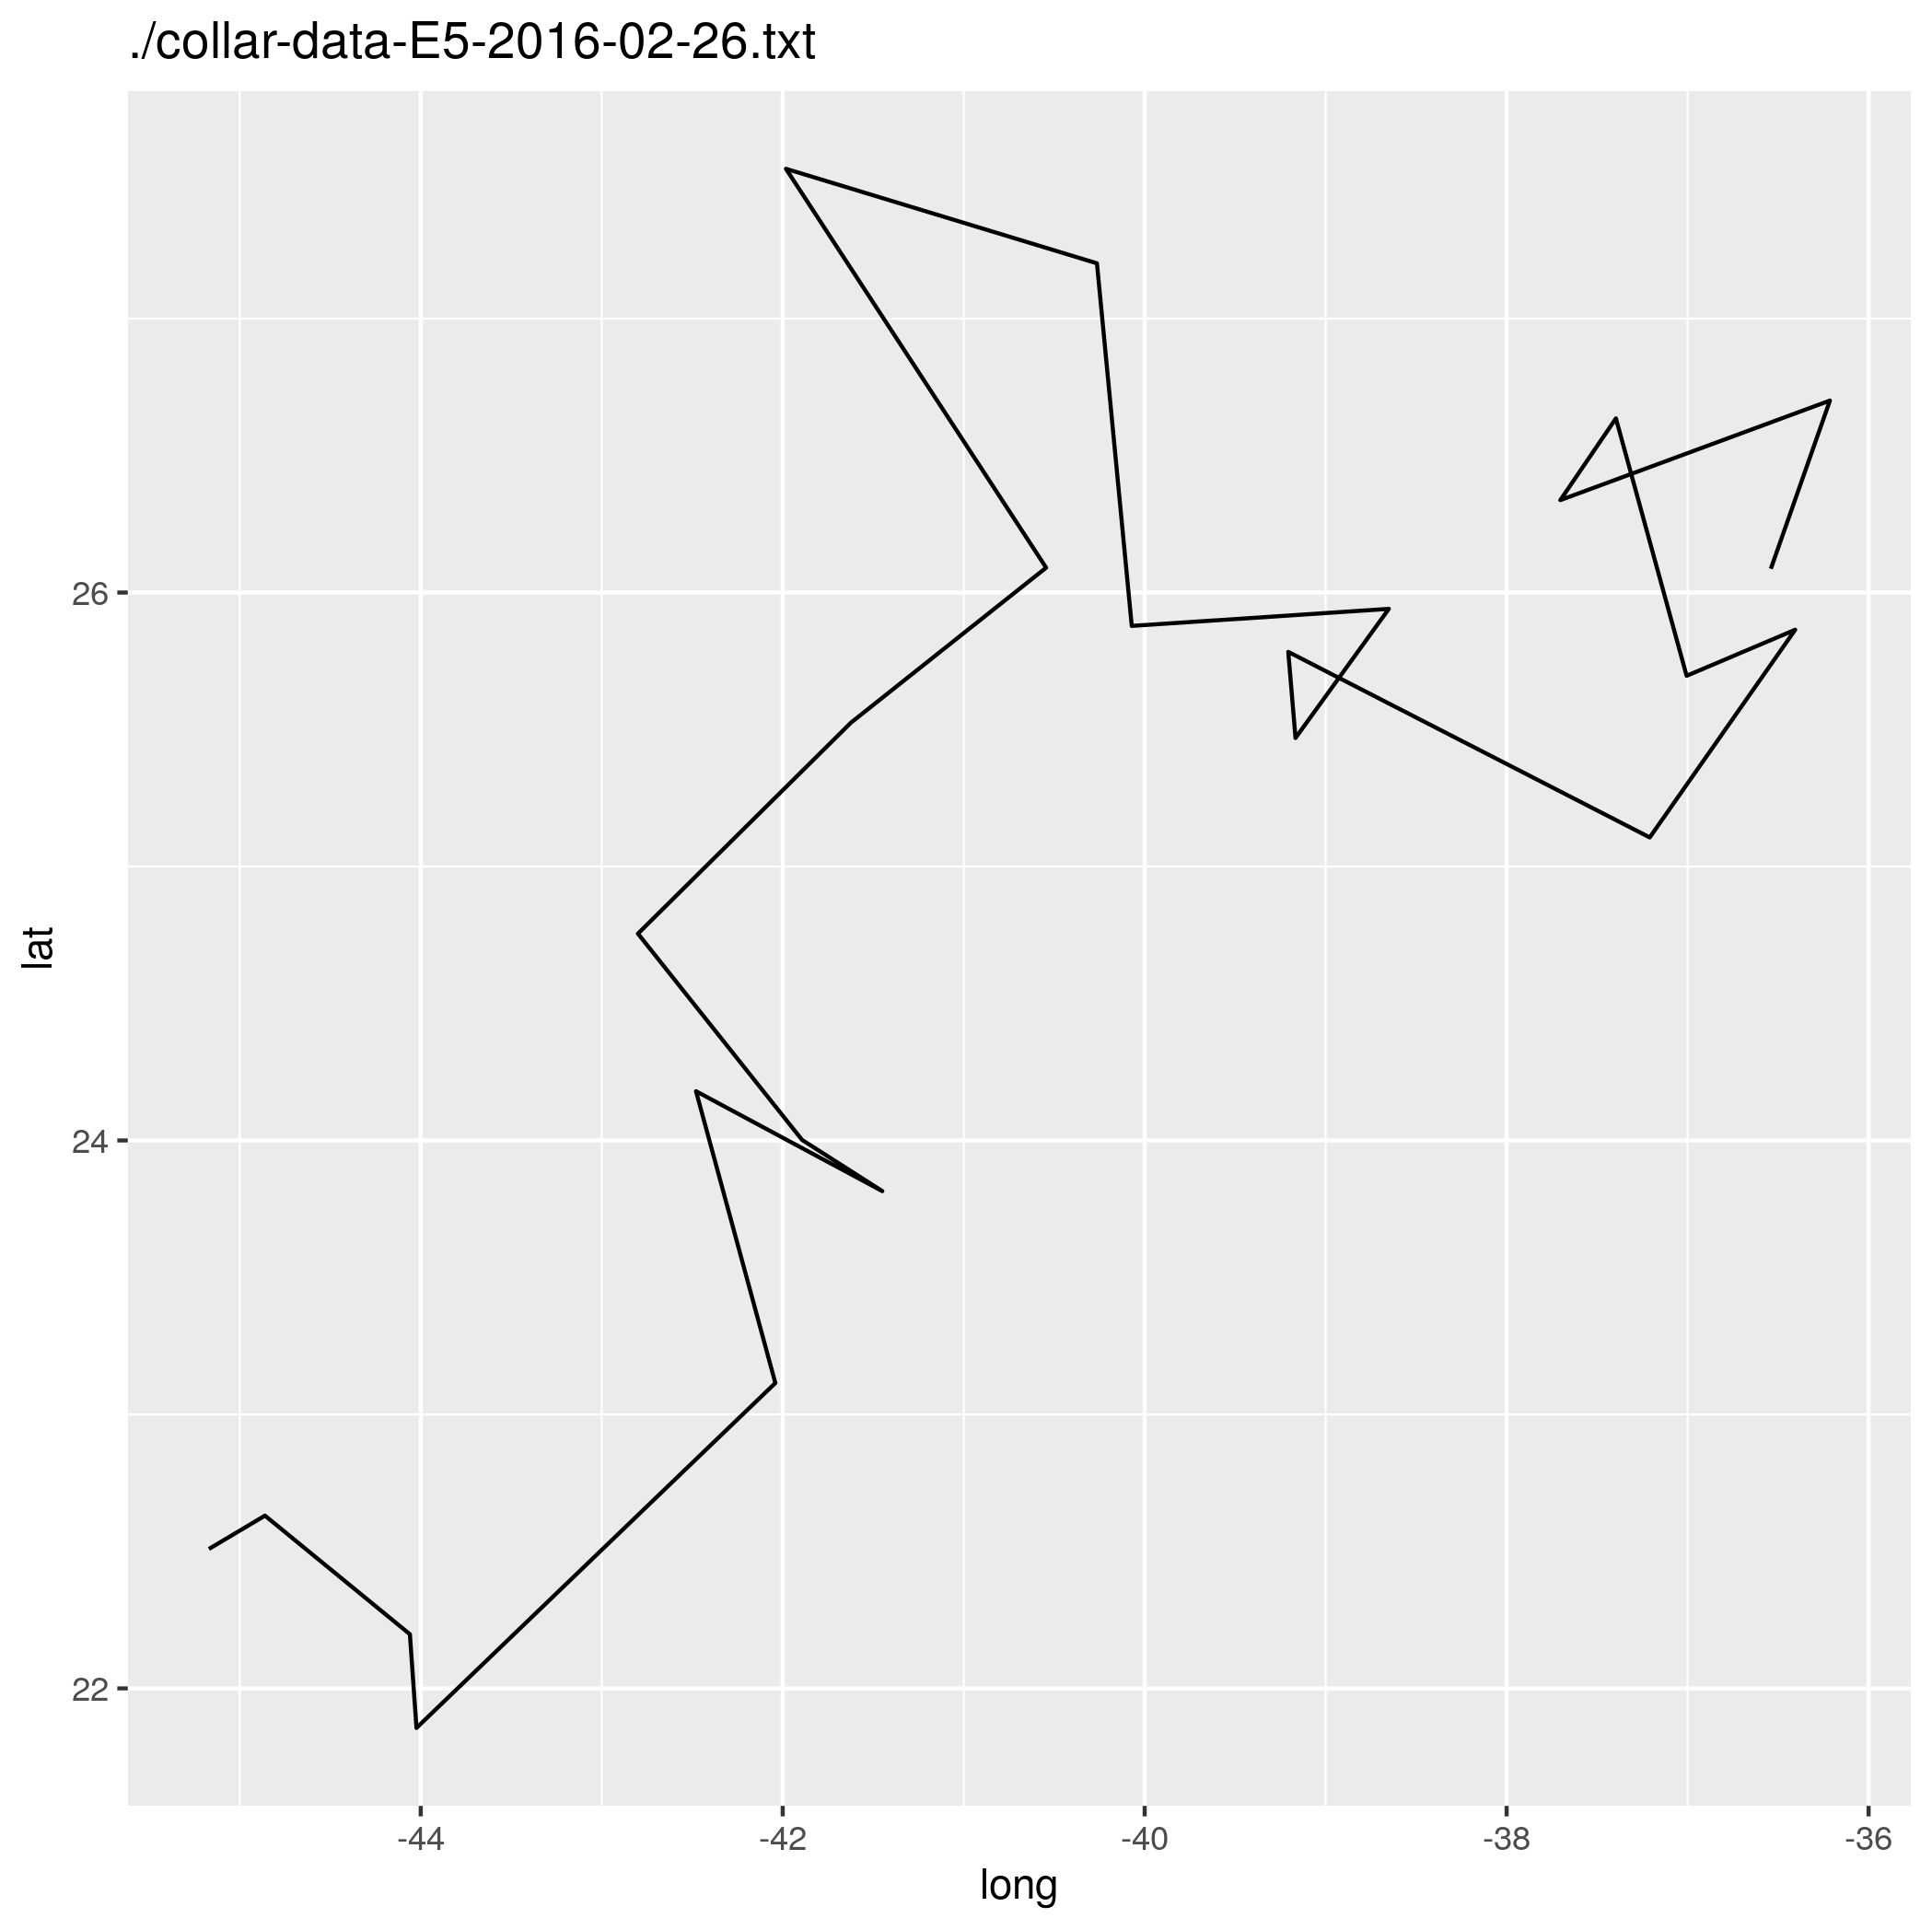
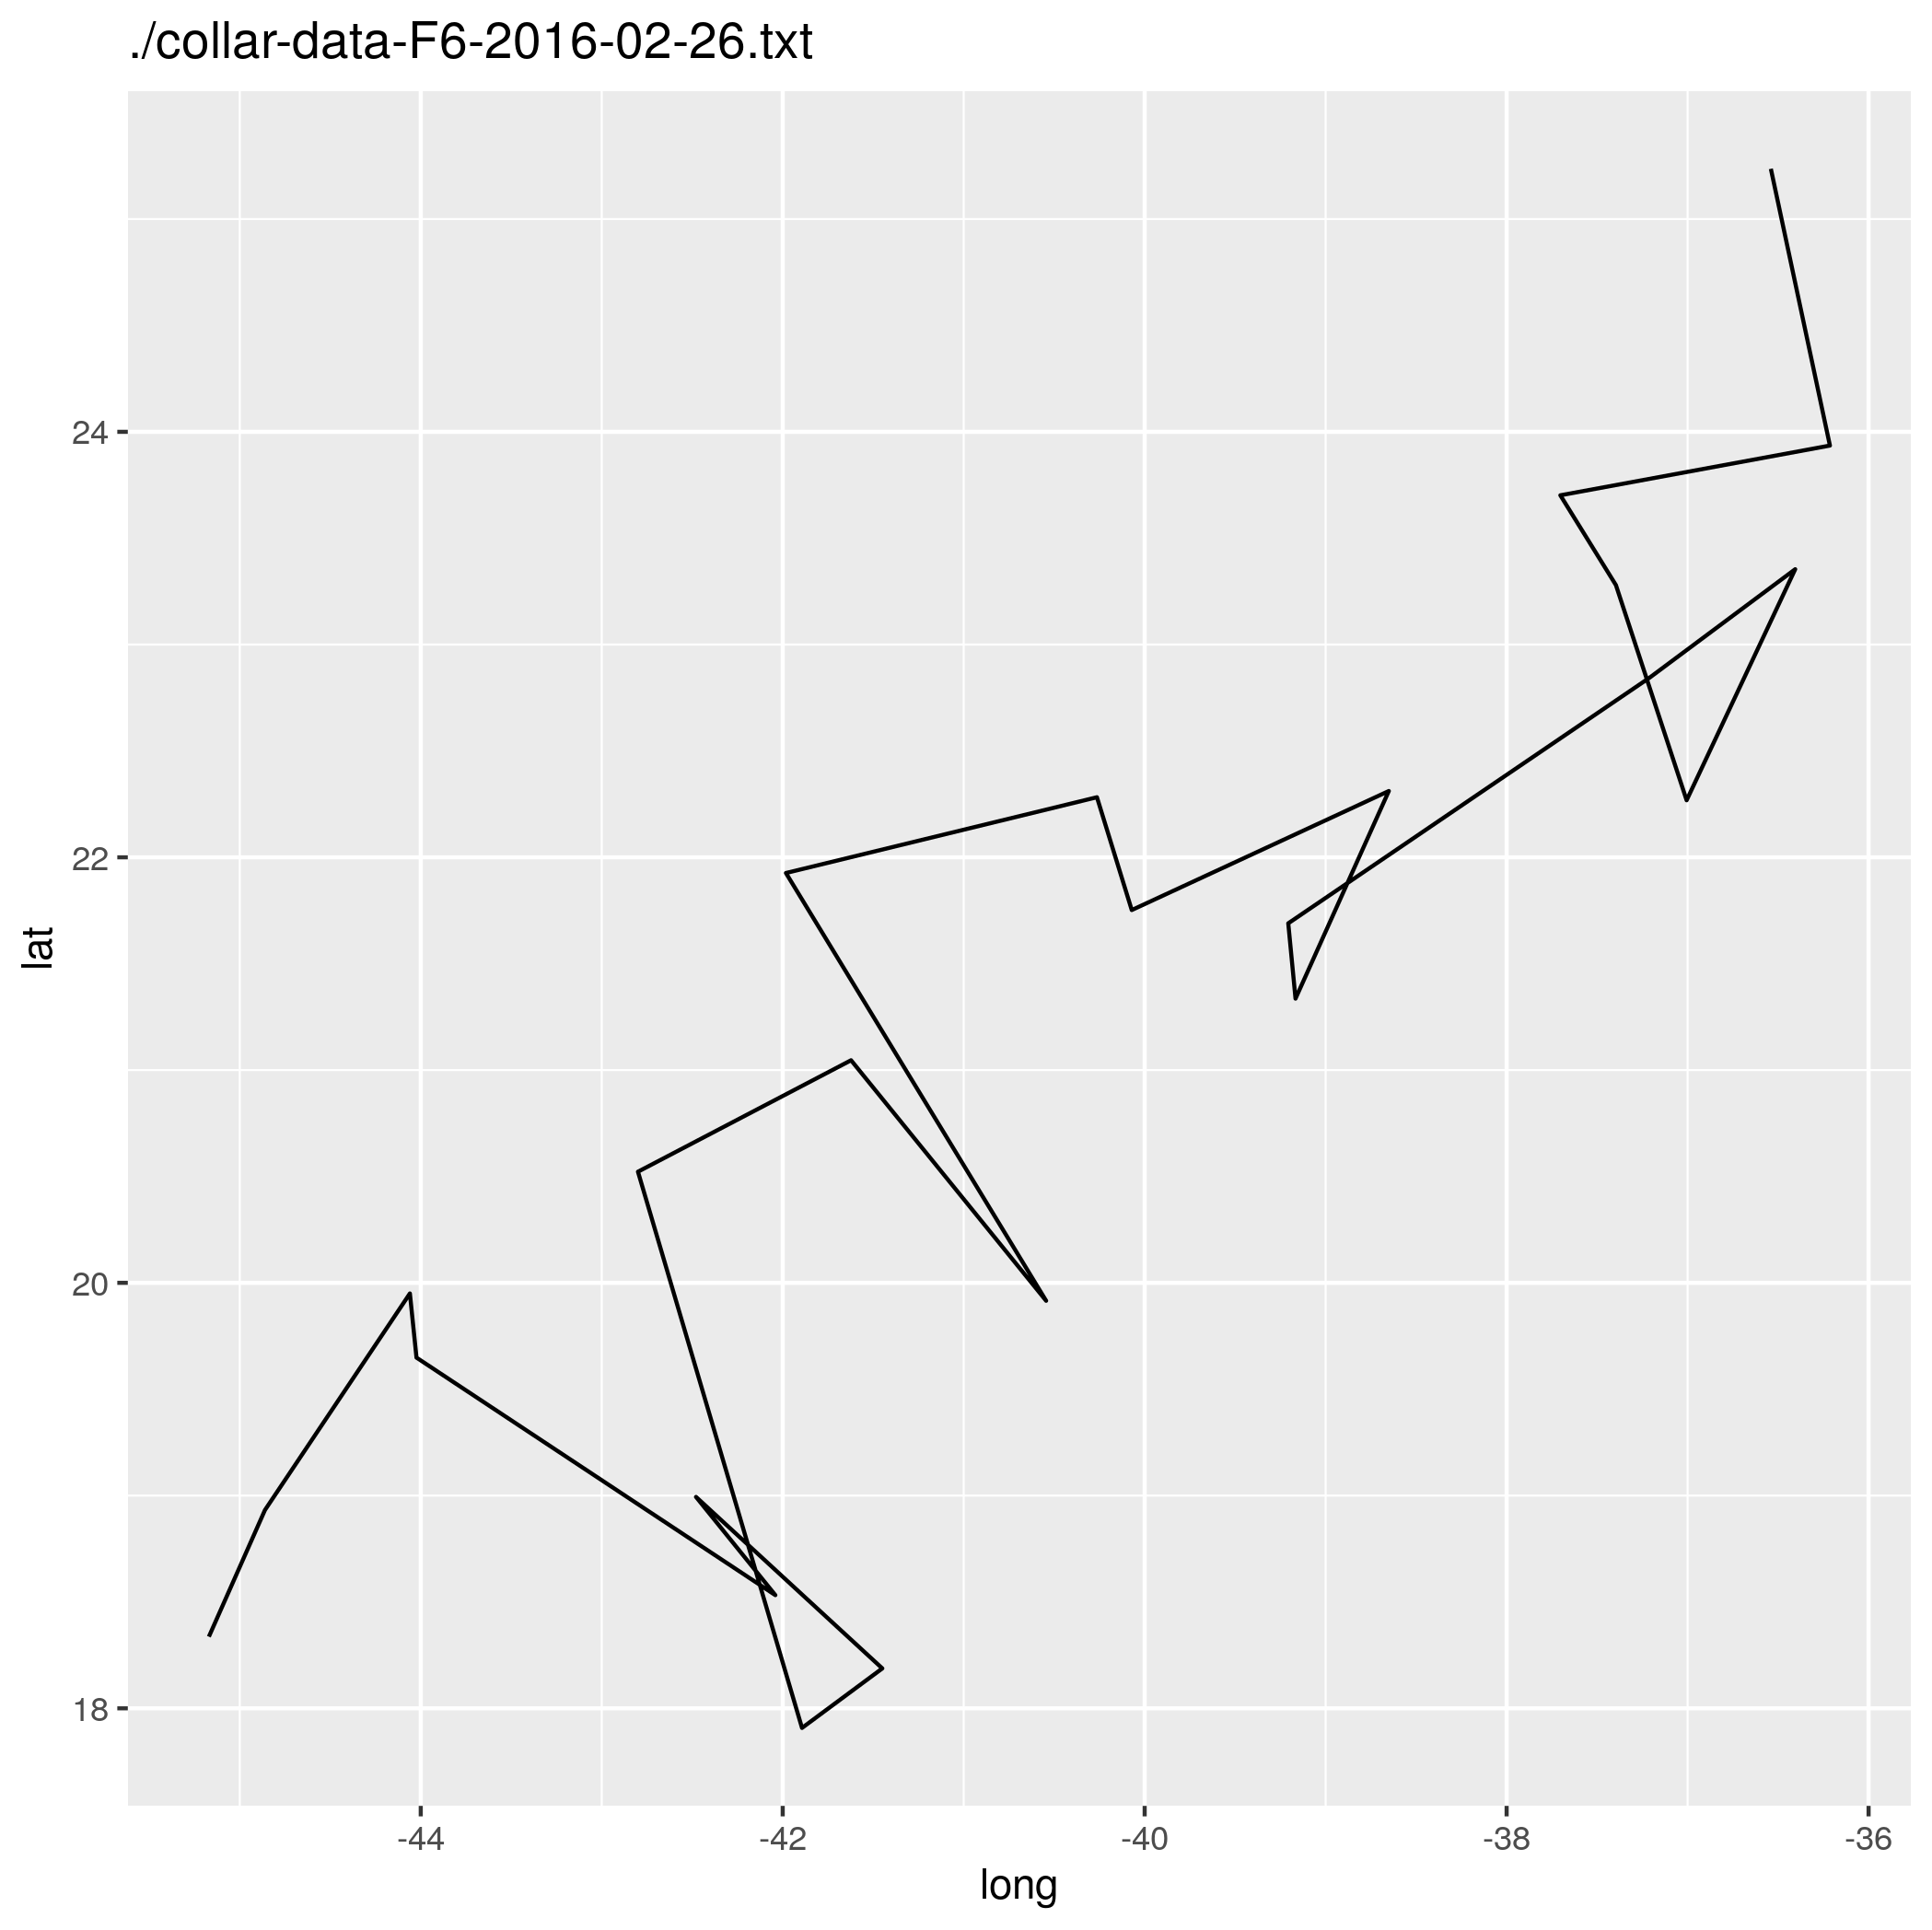
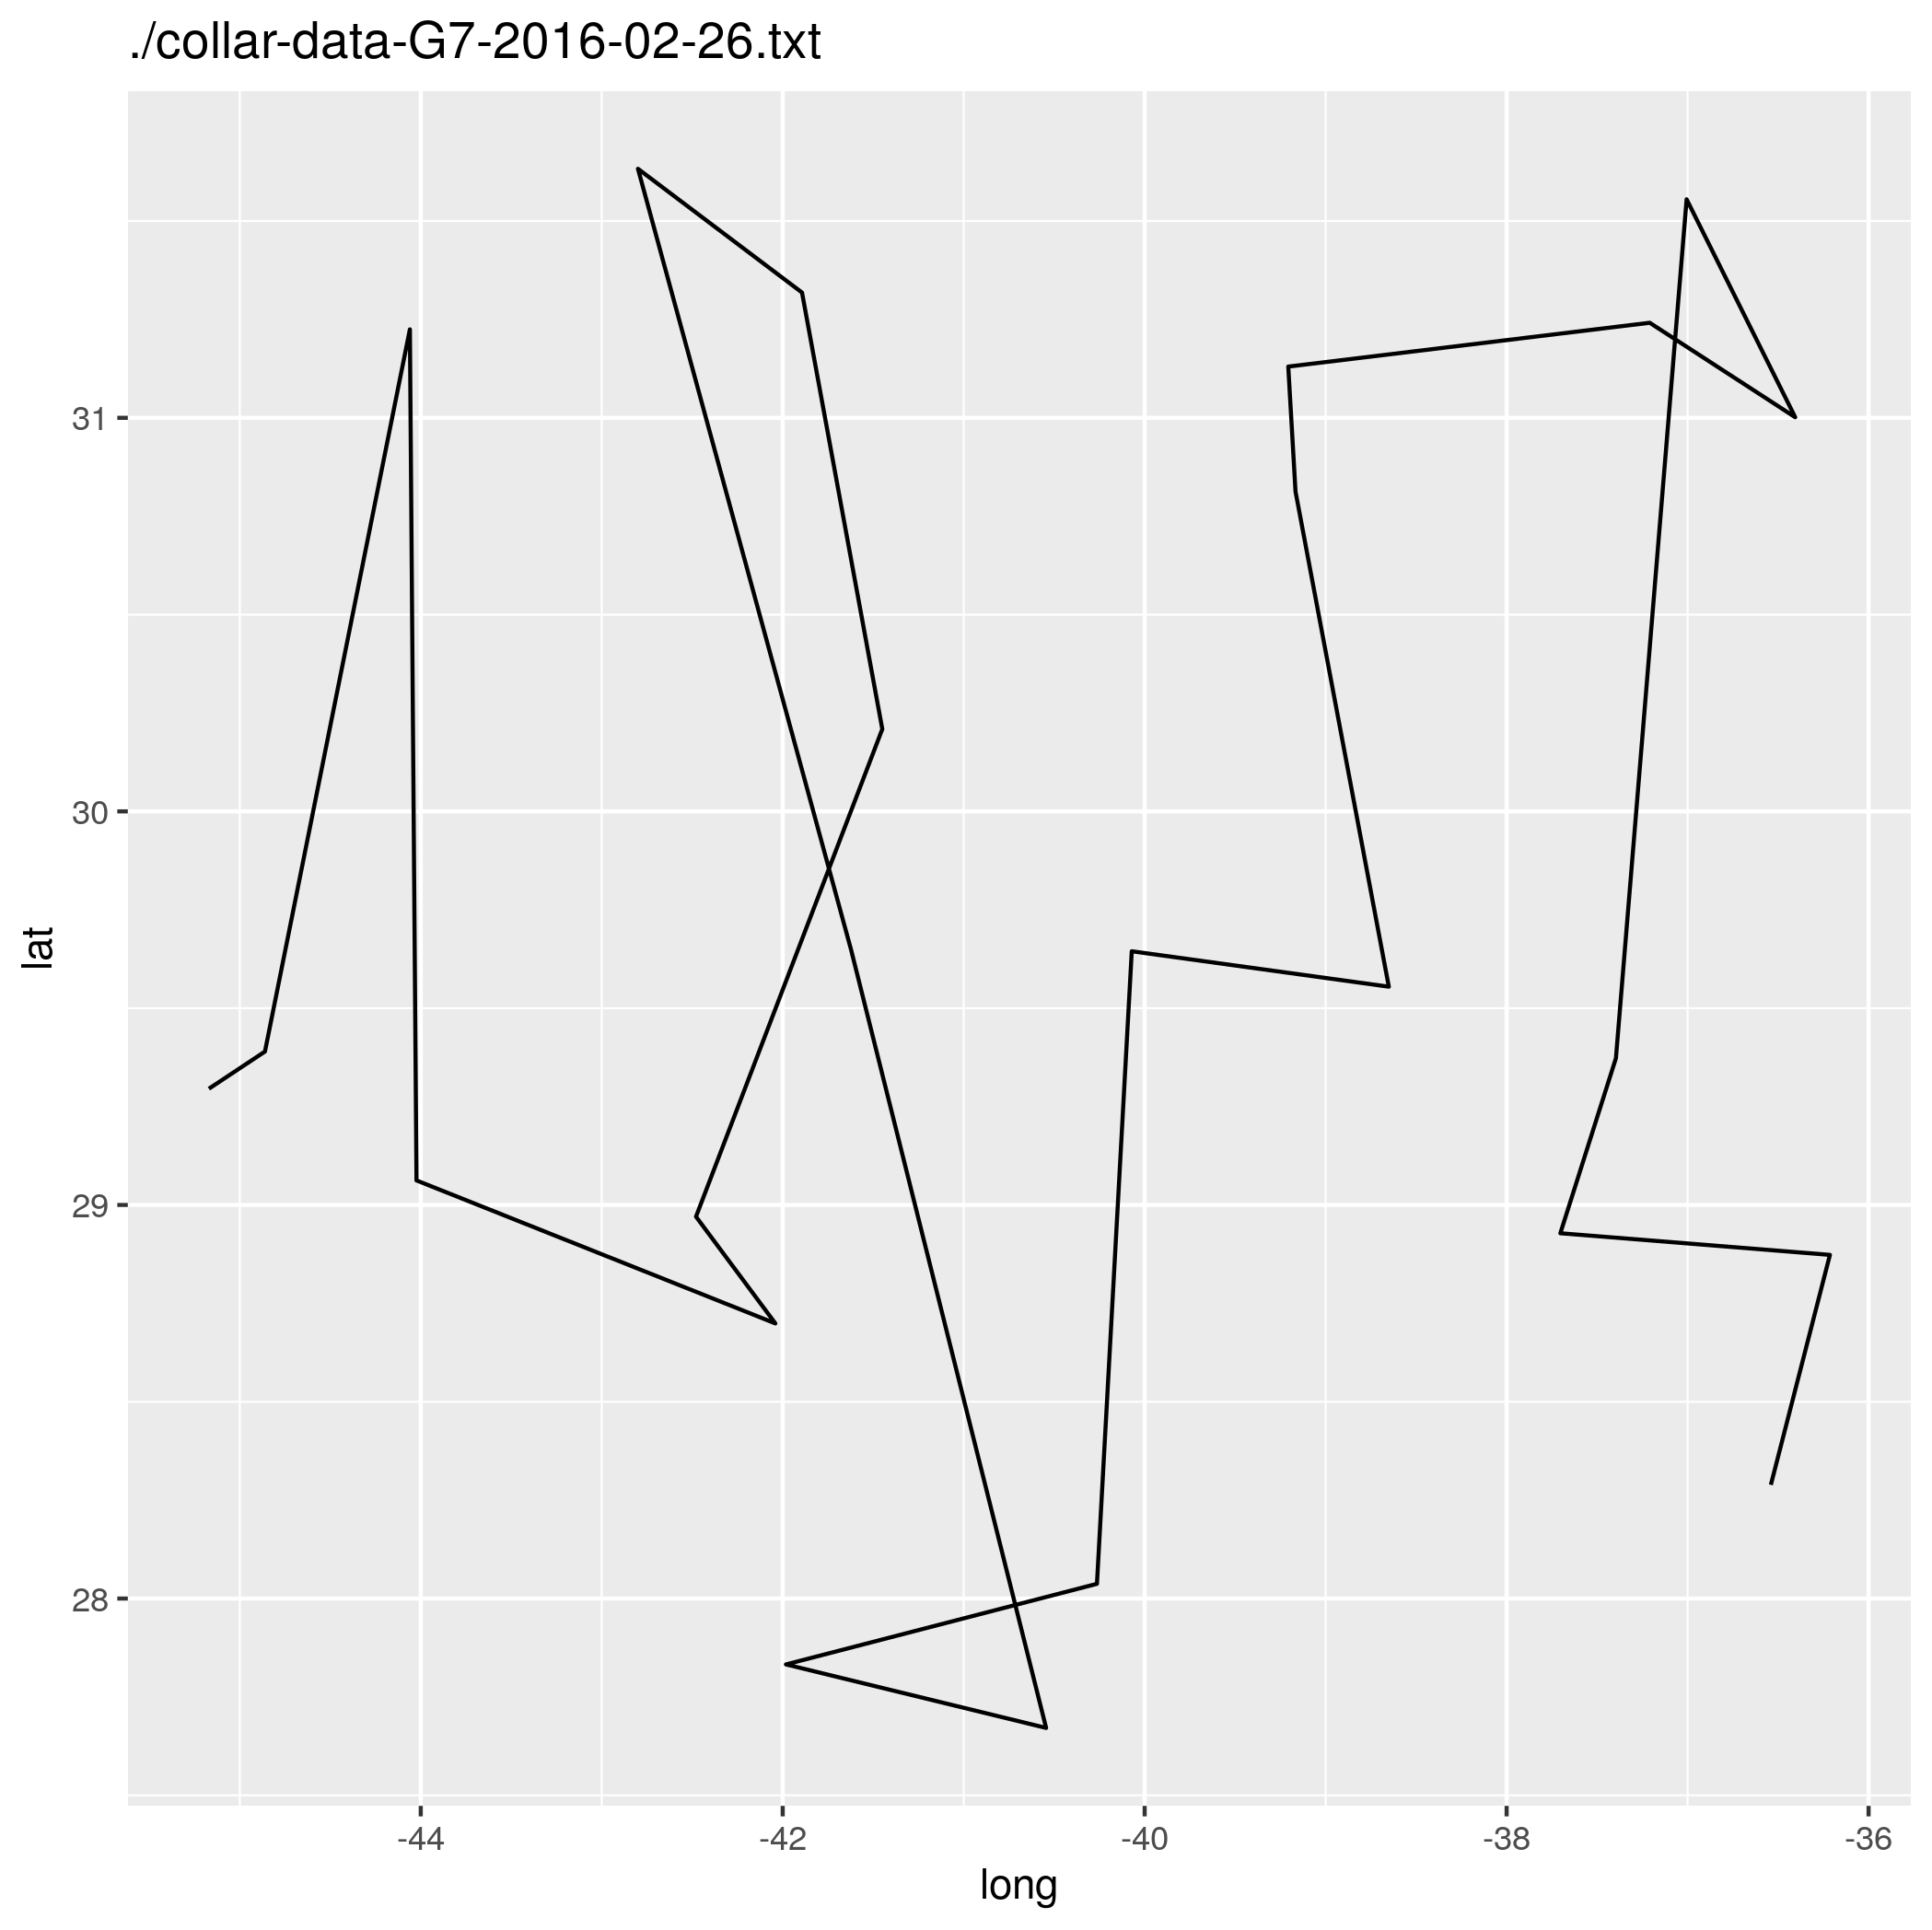
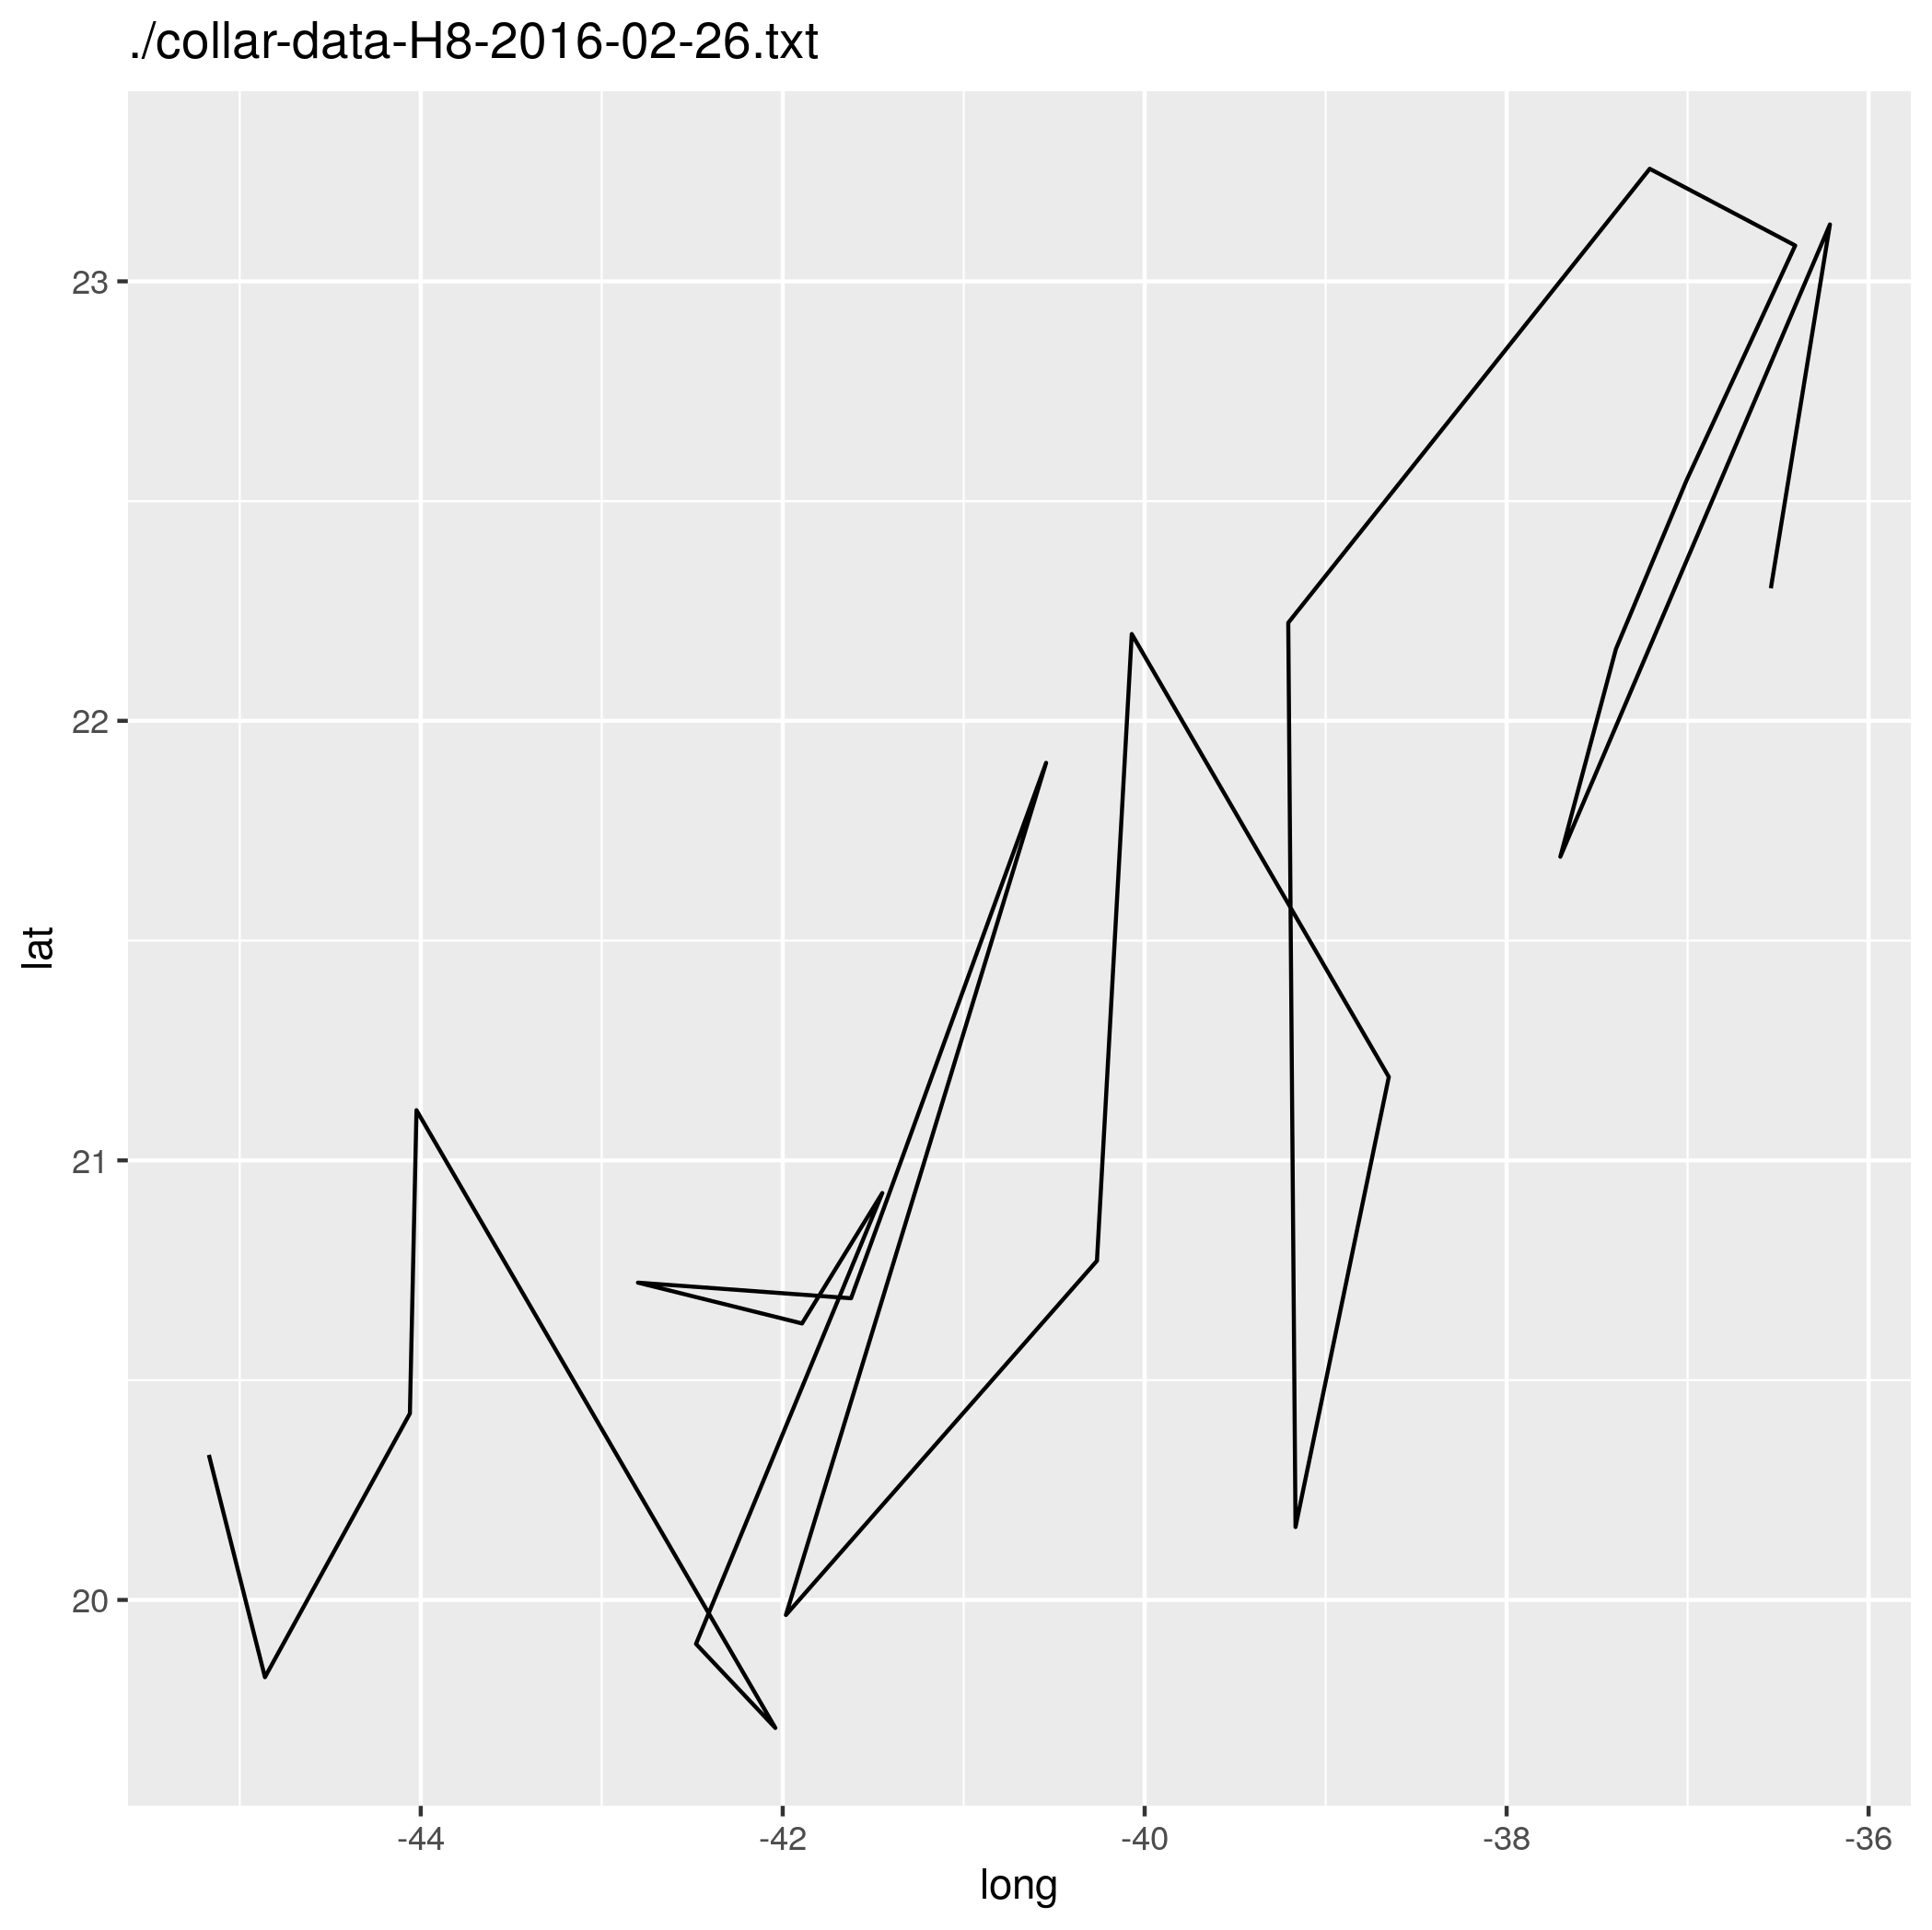
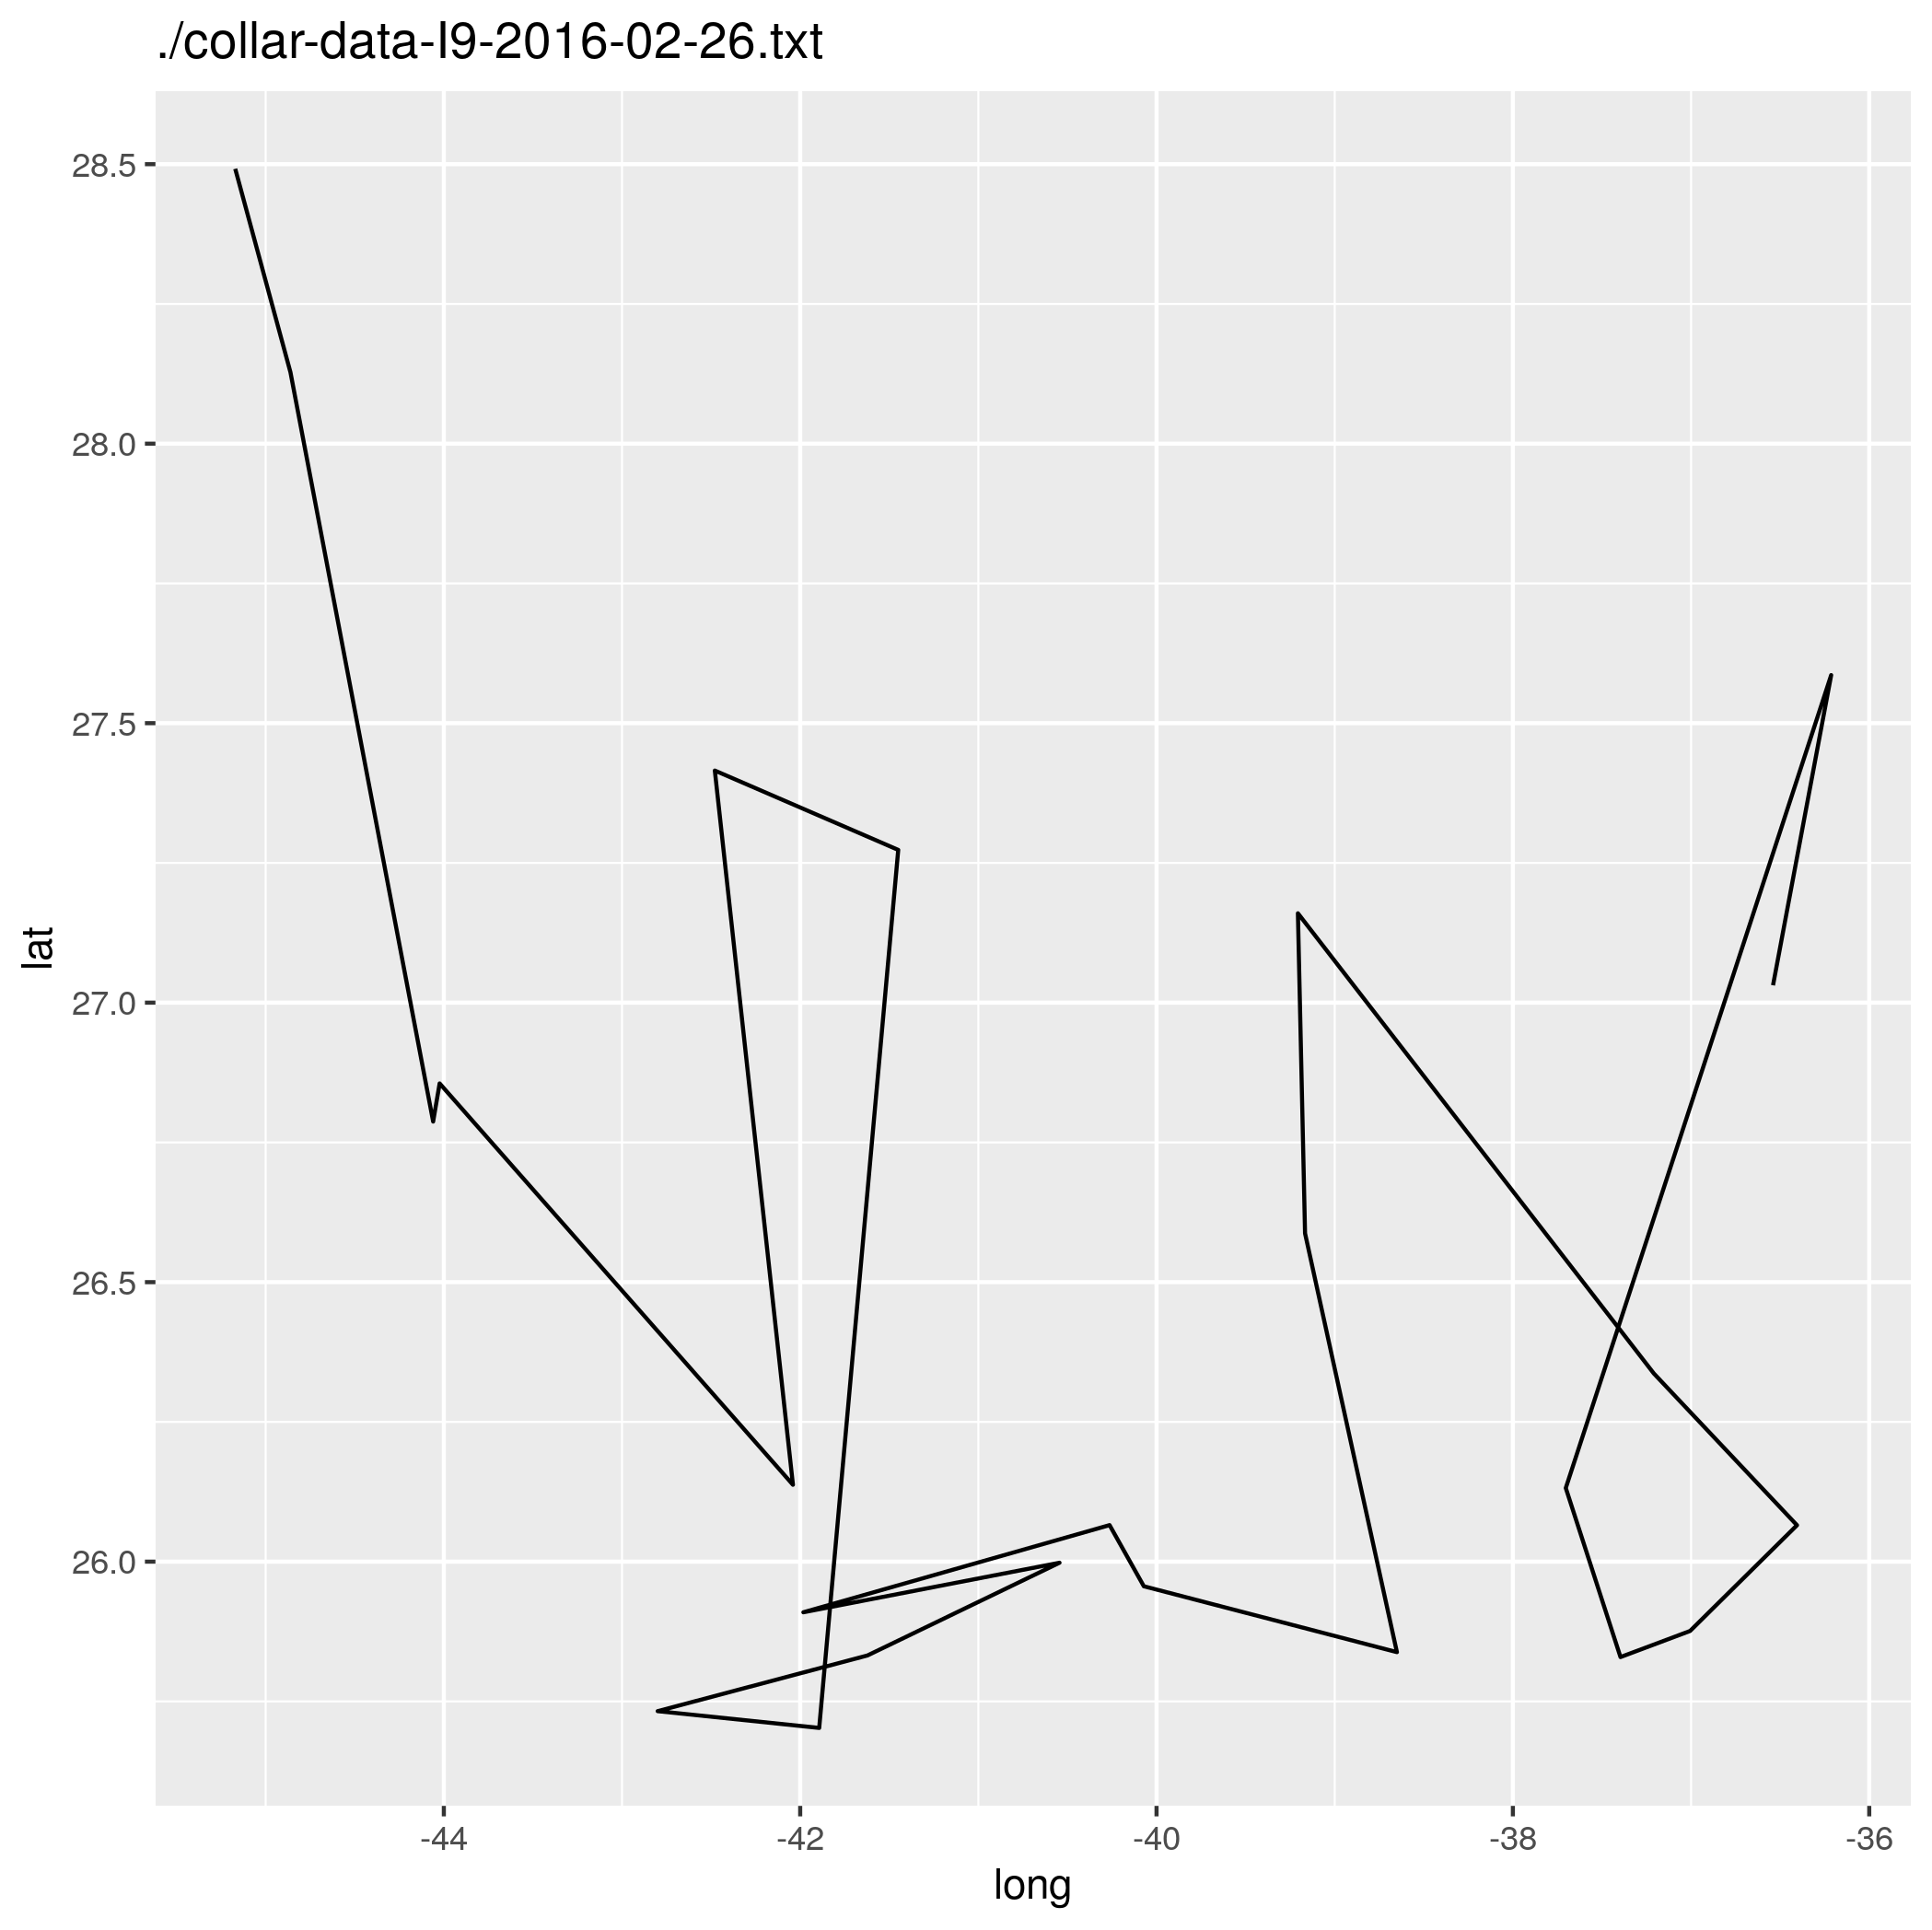
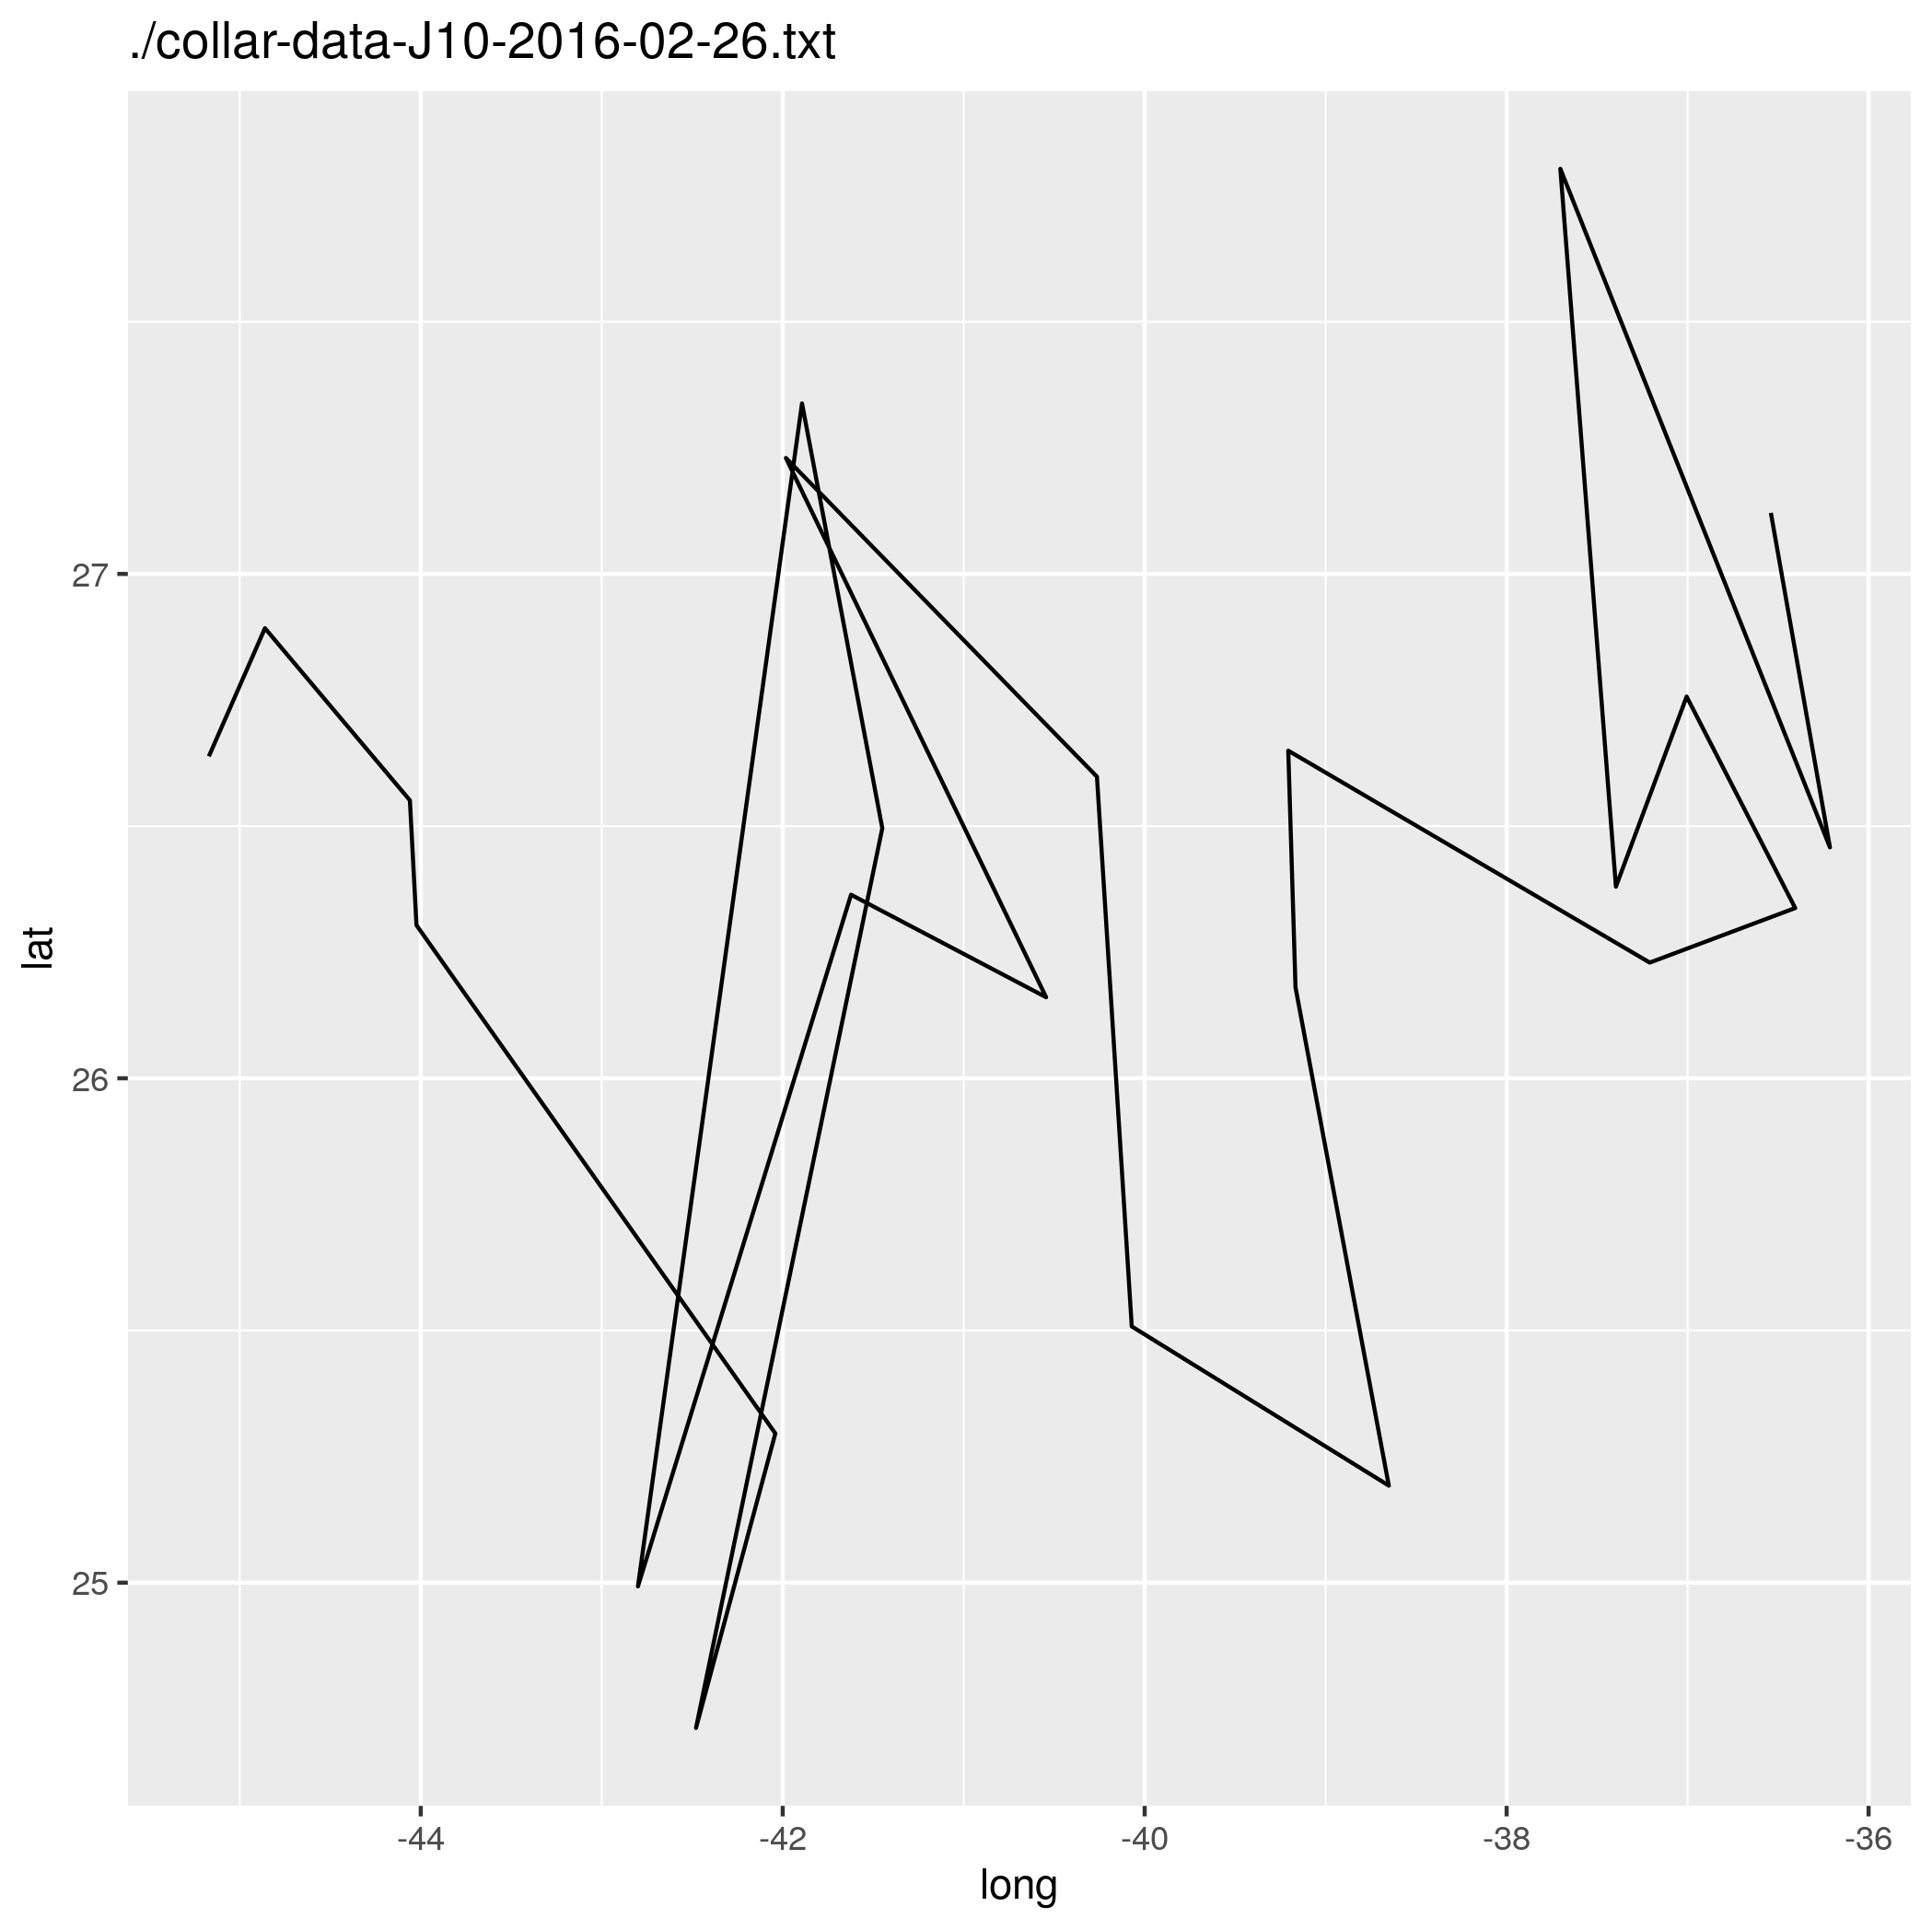
Use a loop to load each of these files into R and make a line plot (using
geom_path()) for each file withlongon thexaxis andlaton theyaxis. Graphs, like other types of output, won’t display inside a loop unless you explicitly display them, so you need put yourggplot()command inside aprint()statement. Include the name of the file in the graph as the graph title usinglabs(). -
Add code to the loop to calculate the minimum and maximum latitude in the file, and store these values, along with the name of the file, in a data frame. Show the data frame as output.
If you’re interested in seeing another application of for loops, check out the code used to simulate the data for this exercise using for loops.
Expected outputs for Multi-file Analysis: 1 2 3 4 5 6 7 8 9 10 11- If
DNA or RNA Iteration (optional)
This is a follow-up to DNA or RNA.
Write a function,
dna_or_rna(sequence), that determines if a sequence of base pairs is DNA, RNA, or if it is not possible to tell given the sequence provided. Since all the function will know about the material is the sequence the only way to tell the difference between DNA and RNA is that RNA has the base Uracil ("u") instead of the base Thymine ("t"). Have the function return one of three outputs:"DNA","RNA", or"UNKNOWN".- Use the function and a
forloop to print the type of the sequences in the following list. - Use the function and
sapplyto print the type of the sequences in the following list.
sequences = c("ttgaatgccttacaactgatcattacacaggcggcatgaagcaaaaatatactgtgaaccaatgcaggcg", "gauuauuccccacaaagggagugggauuaggagcugcaucauuuacaagagcagaauguuucaaaugcau", "gaaagcaagaaaaggcaggcgaggaagggaagaagggggggaaacc", "guuuccuacaguauuugaugagaaugagaguuuacuccuggaagauaauauuagaauguuuacaacugcaccugaucagguggauaaggaagaugaagacu", "gauaaggaagaugaagacuuucaggaaucuaauaaaaugcacuccaugaauggauucauguaugggaaucagccggguc")Optional: For a little extra challenge make your function work with both upper and lower case letters, or even strings with mixed capitalization
Expected outputs for DNA or RNA Iteration: 1- Use the function and a
Cocili Data Exploration (optional)
Understanding the spatial distribution of ecological phenomena is central to the study of natural systems. A group of scientists has collected a dataset on the size, location, and species identify of all of the trees in a 4 ha site in Panama call “Cocoli”.
Download the Cocoli Data and explore the following spatial properties.
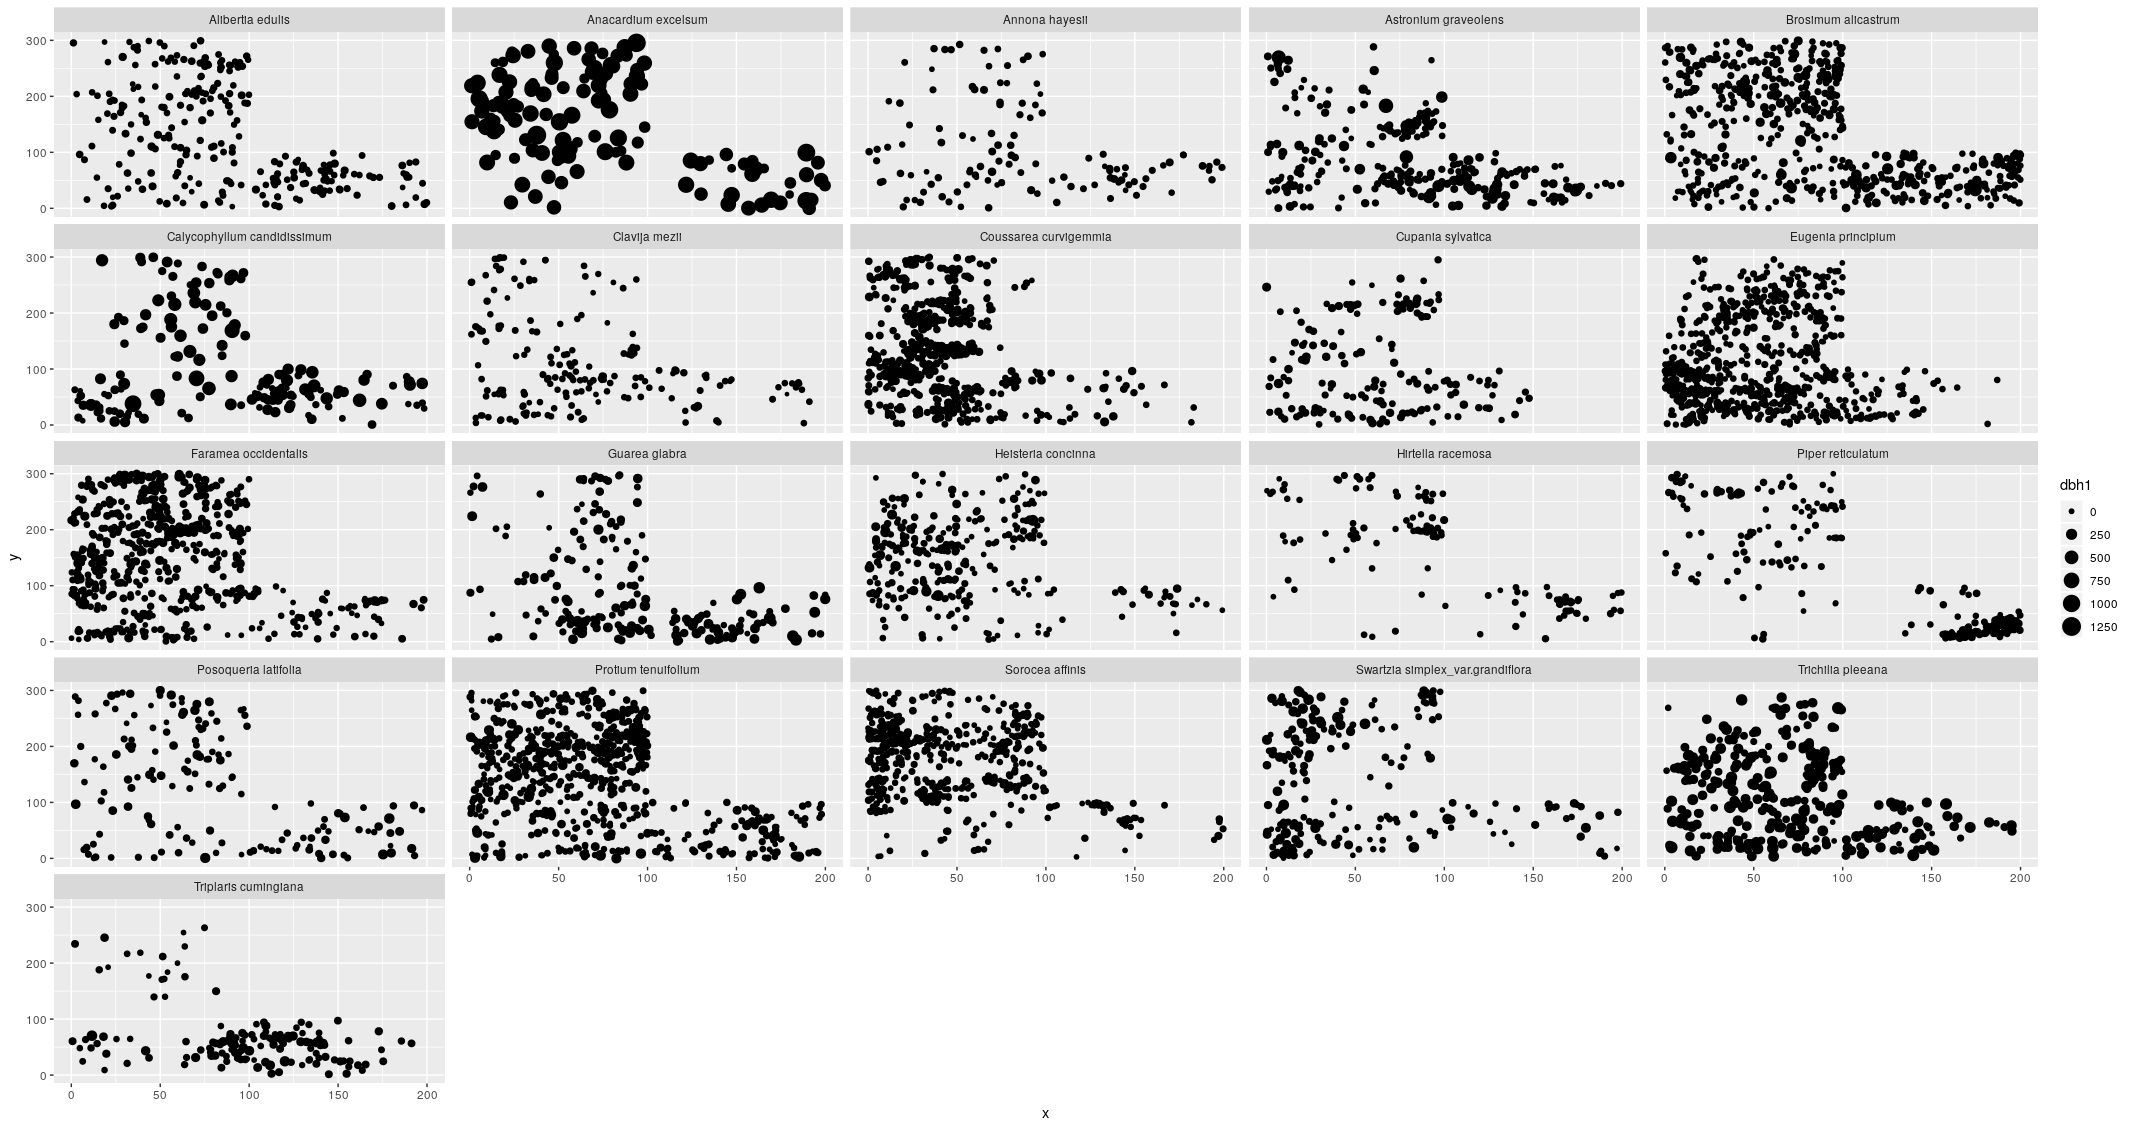
- Make a single plot showing the location of each tree for all species with
more than 100 individuals. Each species should be in its own subplot (i.e.,
facet). Label the subplots with the genus and species names, not the species
code. Scale the size of the point by its stem diameter (use
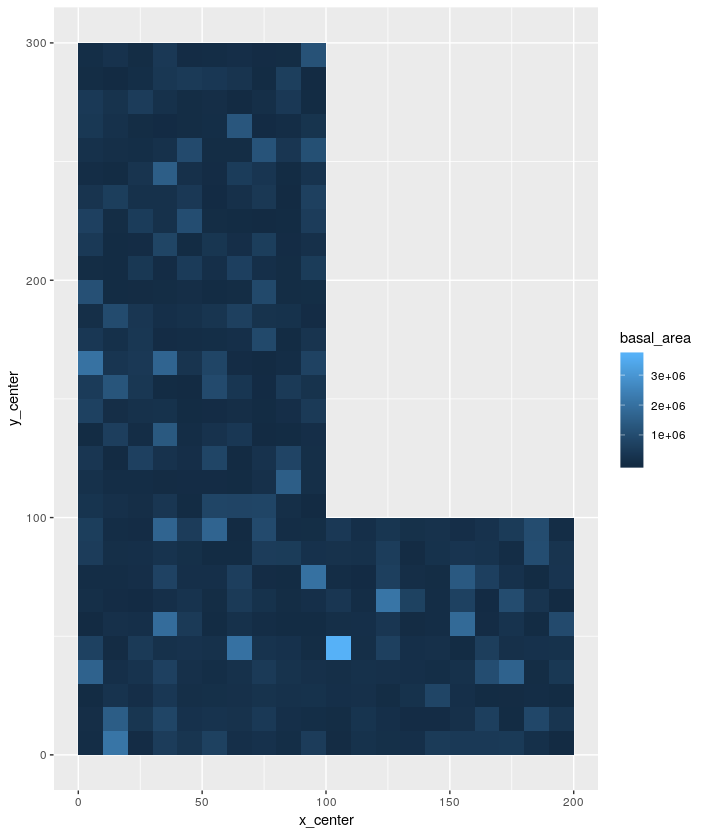
dbh1) so that larger trees display as larger points. Have the code save the plot in afiguresfolder in your project. - Basal area is a common measure in
forest management and ecology. It is the sum of the cross-sectional areas of
all of the trees occuring in some area and can be calculated as the sum of
0.00007854 * DBH^2 over all of the trees. To look at how basal area varies
across the site divide the site into 100 m^2 sample regions (10 x 10 m cells)
and determining the total basal area in each region. I.e., take all of the
trees in a grid cell where x is between 0 and 10 and y is between 0 and 10
and determine their basal area. Do the same thing for x between 0 and 10 and
y between 10 and 20, and so on. You can do this using two “nested” for loops
to subset the data and calculate the basal area in that region. Make a plot
that shows how the basal area varies spatially. Since the calculation is for
a square region, plot it that way using
geom_tile()with the center of the tile at the center of the region where basal area was calculated. Have the code save the plot in afiguresfolder in your project.
- Make a single plot showing the location of each tree for all species with
more than 100 individuals. Each species should be in its own subplot (i.e.,
facet). Label the subplots with the genus and species names, not the species
code. Scale the size of the point by its stem diameter (use
Length of Floods (optional)
You are interested in studying the influence of the timing and length of small scale flood events on an ecosystem. To do this you need to determine when floods occurred and how long they lasted based on stream gauge data.
Download the stream guage data for USGS stream gauge site 02236000 on the St. Johns River in Florida. Find the continuous pieces of the time-series where the stream level is above the flood threshold of 2.26 feet and store the information on the start date and length of each flood in a data frame.
Expected outputs for Length of Floods: 1