File Organization: Organization
Overview
Teaching: 30 min
Exercises: 10 minQuestions
What are the common file organization errors?
What are best practices for file organization?
Objectives
Highlight common SNAFUs
A place for everything, everything in its place - Benjamin Franklin
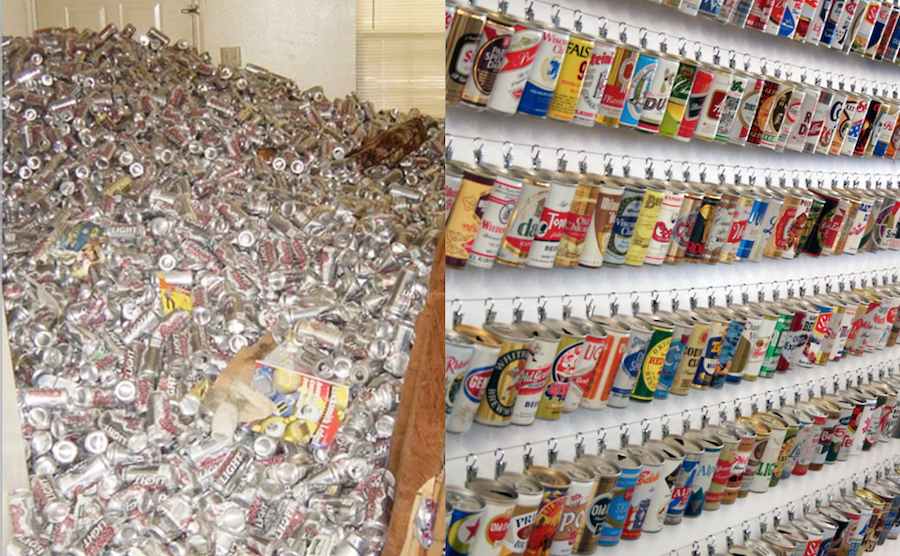

Data analysis workflow

Face it…
- There are going to be files
- LOTS of files
- The files will change over time
- The files will have relationships to each other
- It’ll probably get complicated
Mighty weapon
- File organization and naming is a mighty weapon against chaos
- Make a file’s name and location VERY INFORMATIVE about what it is, why it exists, how it relates to other things
- The more things are self-explanatory, the better
READMEsare great, but don’t document something if you could just make that thing self-documenting by definition
Organizing your data analysis workflow
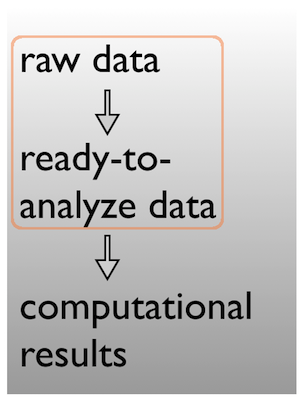
Raw data $\rightarrow$ data
Pick a strategy, any strategy, just pick one and stick to it!
Data $\rightarrow$ results
Pick a strategy, any strategy, just pick one and stick to it!
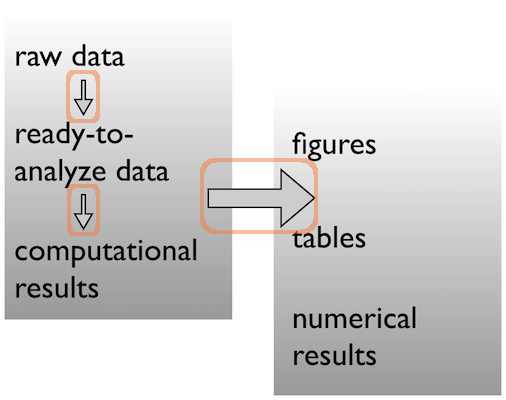
Data $\rightarrow$ results
Pick a strategy, any strategy, just pick one and stick to it!

A real (and imperfect!) example
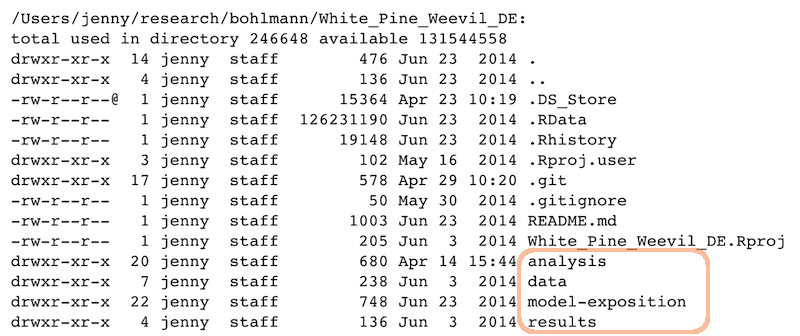
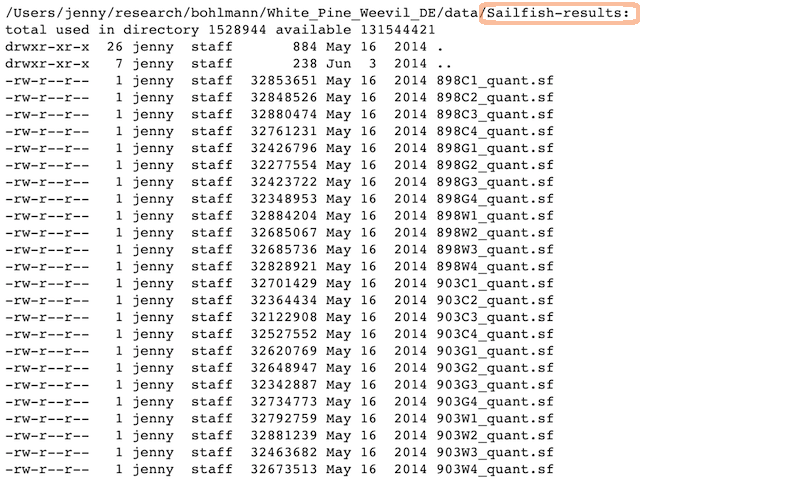
Data
Ready to analyze data:

Raw data:
Analysis and figures
R scripts + the Markdown files from “Compile Notebook”:

The figures created in those R scripts and linked in those Markdown files:

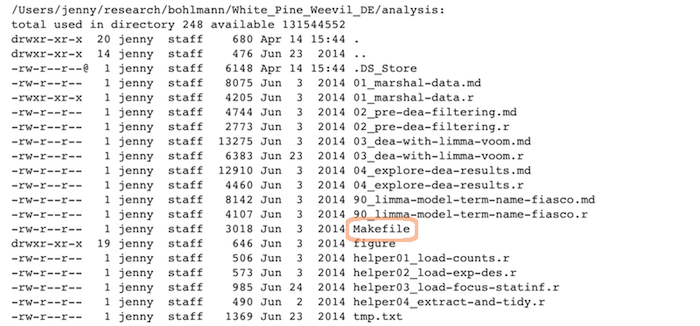
Scripts
Linear progression of R scripts, and Makefile to run the entire analysis:
Results
Tab-delimited files with one row per gene of parameter estimates, test statistics, etc.:

Expository files
Files to help collaborators understand the model we fit: some markdown docs, a Keynote presentation, Keynote slides exported as PNGs for viewability on GitHub:

Caveats / problems with this example
- This project is no where near done, i.e. no manuscript or publication-ready figs.
- File naming has inconsistencies due to three different people being involved.
- Code and reports/figures all sit together because it’s just much easier that way w/
knitr&RMarkdown.
Wins of this example
- I can walk away from the project and come back to it a year later and resume work fairly quickly
- The two other people (the post-doc whose project it is + the bioinformatician for that lab) were able to figure out what I did and decide which files they needed to look at, etc.
GOOD ENOUGH!
Other tips
Tips: the from_joe directory
- Let’s say my collaborator and data producer is Joe.
- He will send me data with weird space-containing file names, data in Microsoft Excel workbooks, etc.
- It is futile to fight this, just quarantine all the crazy here. I rename things and/or export to plain text and put those files in my data directory.
- Whether I move, copy, or symlink depends on the situation.
- Whatever I did gets recorded in a
READMEor in comments in myRcode – whatever makes it easiest for me to remind myself of a file’s provenance, if it came from the outside world in a state that was not ready for programmatic analysis.
Tip: give yourself less rope
- I often revoke my own write permission to the raw data file.
- Then I can’t accidentally edit it.
- It also makes it harder to do manual edits in a moment of weakness, when you know you should just add a line to your data cleaning script.
Tip: prose
- Sometimes you need a place to park key emails, internal documentation and explanations, random Word and PowerPoint docs people send, etc.
- This is kind of like
from_joe, where I don’t force myself to keep same standards with respect to file names and open formats.
Tip: life cycle of data
Here’s how most data analyses go down in reality:
- You get raw data
- You explore, describe and visualize it
- You diagnose what this data needs to become useful
- You fix, clean, marshal the data into ready-to-analyze form
- You visualize it some more
- You fit a model or whatever and write lots of numerical results to file
- You make prettier tables and many figures based on the data & results accumulated by this point
- Both the data file(s) and the code/scripts that acts on them reflect this progression
Prepare data $\rightarrow$ Do stats $\rightarrow$ Make tables & figs
The R scripts:
01_marshal-data.r
02_pre-dea-filtering.r
03_dea-with-limma-voom.r
04_explore-dea-results.r
90_limma-model-term-name-fiasco.r
The figures left behind:
02_pre-dea-filtering-preDE-filtering.png
03-dea-with-limma-voom-voom-plot.png
04_explore-dea-results-focus-term-adjusted-p-values1.png
04_explore-dea-results-focus-term-adjusted-p-values2.png
...
90_limma-model-term-name-fiasco-first-voom.png
90_limma-model-term-name-fiasco-second-voom.png
Recap
File organization should reflect inputs vs outputs and the flow of information
/Users/jenny/research/bohlmann/White_Pine_Weevil_DE:
drwxr-xr-x  20 jenny  staff        680 Apr 14 15:44 analysis
drwxr-xr-x   7 jenny  staff        238 Jun  3  2014 data
drwxr-xr-x  22 jenny  staff        748 Jun 23  2014 model-exposition
drwxr-xr-x   4 jenny  staff        136 Jun  3  2014 results

Key Points
File organization is important.