Content from Introduction
Last updated on 2023-05-03 | Edit this page
Overview
Questions
- What are basic principles for using spreadsheets for good data organization?
Objectives
- Understand how to organize data so computers can make the best use of the data
Things You’ll Need To Complete This Tutorial
Spreadsheet Software
To work through this tutorial you will need access to a spreadsheet program. Many computers come with a pre-installed spreadsheet program like Excel. macOS users who use Apple’s Numbers application should note that it does not contain some of the features (particularly data validation) that we will be using. Please use LibreOffice or Microsoft Excel instead.
If you do not have a spreadsheet program, install one using the instructions in the link below.
Good data organization is the foundation of your research project. Most researchers have data or do data entry in spreadsheets. Spreadsheet programs are very useful graphical interfaces for designing data tables and handling very basic data quality control functions.
Spreadsheet outline
In this lesson, we’re going to talk about:
- Good data entry practices - formatting data tables in spreadsheets
- How to avoid common formatting mistakes
- Recognising and reformatting dates in spreadsheets
- Basic quality control and data manipulation in spreadsheets
- Exporting data from spreadsheets
Spreadsheet programs
Many spreadsheet programs are available. We will use Microsoft Excel in our examples. Although it is not open source software it is very widely available and used.
Free spreadsheet programs such as LibreOffice are available. The functionality of these may differ from Excel, but in general they can be used to perform similar tasks.
Problems with Spreadsheets
Spreadsheets are good for data entry, but in reality we tend to use spreadsheet programs for much more than data entry. We use them to create data tables for publications, to generate summary statistics, and make figures. Laying out spreadsheets in this way often adds some difficulty when we want to take our data from the spreadsheet and use it in another program. Additional white space, merged cells, colour and grids may aid readability but are not easily handled by other programs that take our spreadsheet as an input to further analysis.
Generating statistics and figures in spreadsheets should be done with caution. The graphical, drag and drop nature of spreadsheet programs means that it can be very difficult, if not impossible, to replicate your steps (much less retrace anyone else’s). This is particularly true if your stats or figures require complex calculations. Furthermore, when performing calculations in a spreadsheet, it’s easy to accidentally apply a slightly different formula to multiple adjacent cells. This often makes it difficult to demonstrate data quality and consistency in our analysis.
Even when we are aware of some of the limitations that data in spreadsheets presents, often we have inherited spreadsheets from another colleague or data provider. In these situations we cannot exercise any control in its construction or entry of the data within it. Nevertheless it is important to be aware of the limitations these data may present, and know how to assess if any problems are present and how to overcome them.
What this lesson will not teach you
- How to do statistics in a spreadsheet
- How to do plotting in a spreadsheet
- How to write code in spreadsheet programs
If you’re looking to do this, a good reference is Head First Excel, published by O’Reilly.
Using Spreadsheets for Data Entry and Cleaning
However, there are circumstances where you might want to use a spreadsheet program to produce “quick and dirty” calculations or figures, and some of these features can be used in data cleaning, prior to importation into a statistical analysis program. We will show you how to use some features of spreadsheet programs to check your data quality along the way and produce preliminary summary statistics.
In this lesson, we will assume that you are most likely using Excel as your primary spreadsheet program - there are other programs with similar functionality but Excel seems to be the most commonly used.
In this lesson we’re going to talk about:
Content from Formatting Data Tables in Spreadsheets
Last updated on 2023-05-03 | Edit this page
Overview
Questions
- What are some common challenges with formatting data in spreadsheets and how can we avoid them?
Objectives
- Recognise and resolve common spreadsheet formatting problems.
- Describe the importance of metadata.
- Identify metadata that should be included with a dataset.
Data formatting problems
The most common mistake made is treating spreadsheet programs like lab notebooks, that is, relying on context, notes in the margin, spatial layout of data and fields to convey information. As humans, we can (usually) interpret these things, but computers don’t view information the same way, and unless we explain to the computer what every single thing means (and that can be hard!), it will not be able to see how our data fit together.
Using the power of computers, we can manage and analyze data in much more effective and faster ways, but to use that power, we have to set up our data for the computer to be able to understand it (and computers are very literal).
This is why it’s extremely important to set up well-formatted tables from the outset - before you even start entering data from your very first preliminary experiment. Data organization is the foundation of your research project. It can make it easier or harder to work with your data throughout your analysis, so it’s worth thinking about when you’re doing your data entry or setting up your experiment. You can set things up in different ways in spreadsheets, but some of these choices can limit your ability to work with the data in other programs or have the you-of-6-months-from-now or your collaborator work with the data.
Keeping track of your analyses
When you’re working with spreadsheets, during data clean up or analyses, it’s very easy to end up with a spreadsheet that looks very different from the one you started with. In order to be able to reproduce your analyses or figure out what you did when Reviewer #3 asks for a different analysis, you should
- create a new file or tab with your cleaned or analyzed data. Don’t modify the original dataset, or you will never know where you started!
- keep track of the steps you took in your clean up or analysis. You should track these steps as you would any step in an experiment. You can do this in another text file, or a good option is to create a new tab in your spreadsheet with your notes. This way the notes and data stay together.
Put these principles in to practice today during the exercises.
Structuring data in spreadsheets
The cardinal rules of using spreadsheet programs for data:
- Put all your variables in columns - the thing you’re measuring, like ‘weight’ or ‘temperature’.
- Put each observation in its own row.
- Don’t combine multiple pieces of information in one cell. Sometimes it just seems like one thing, but think if that’s the only way you’ll want to be able to use or sort that data.
- Leave the raw data raw - don’t change it!
- Export the cleaned data to a text-based format like CSV (comma-separated values) format. This ensures that anyone can use the data, and is required by most data repositories.
For instance, we’re going to be working with data from a study of agricultural practices among farmers in two countries in eastern sub-Saharan Africa (Mozambique and Tanzania). Researchers conducted interviews with farmers in these countries to collect data on household statistics (e.g. number of household members, number of meals eaten per day, availability of water), farming practices (e.g. water usage), and assets (e.g. number of farm plots, number of livestock). They also recorded the dates and locations of each interview.
If they were to keep track of the data like this:
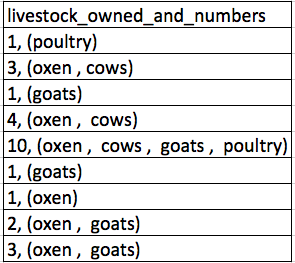
the problem is that number of livestock and type of livestock are in the same field. So, if they wanted to look at the average number of livestock owned, or the average number of each type of livestock, it would be hard to do this using this data setup. If instead we put the count of each type of livestock in its own column, this would make analysis much easier. The rule of thumb, when setting up a datasheet, is that each variable (in this case, each type of livestock) should have its own column, each observation should have its own row, and each cell should contain only a single value. Thus, the example above should look like this:
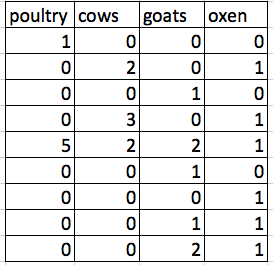
Notice that this now allows us to make statements about the number of each type of animal that a farmer owns, while still allowing us to say things about the total number of livestock. All we need to do is sum the values in each row to find a total. We’ll be learning how to do this computationally and reproducibly later in this workshop.
Workshop Data
The data used in these lessons are taken from interviews of farmers in two countries in eastern sub-Saharan Africa (Mozambique and Tanzania). These interviews were conducted between November 2016 and June 2017 and probed household features (e.g. construction materials used, number of household members), agricultural practices (e.g. water usage), and assets (e.g. number and types of livestock).
This is a real dataset, however, it has been simplified for this workshop. If you’re interested in exploring the full dataset further, you can download it from Figshare and work with it using exactly the same tools we’ll learn about today.
For more information about the dataset and to download it from Figshare, check out the Social Sciences workshop data page.
LibreOffice Users
The default for LibreOffice is to treat tabs, commas, and semicolons as delimiters. This behavior can cause problems with both the data for this lesson and other data you might want to use. This can be fixed when opening LibreOffice by deselecting the “semicolons” and “tabs” checkboxes.
Exercise
We’re going to take a messy version of the SAFI data and describe how we would clean it up.
- Download the messy data.
- Open up the data in a spreadsheet program.
- Notice that there are two tabs. Two researchers conducted the interviews, one in Mozambique and the other in Tanzania. They both structured their data tables in a different way. Now, you’re the person in charge of this project and you want to be able to start analyzing the data.
- With the person next to you, identify what is wrong with this spreadsheet. Discuss the steps you would need to take to clean up the two tabs, and to put them all together in one spreadsheet.
Important Do not forget our first piece of advice, to create a new file (or tab) for the cleaned data, never modify your original (raw) data.
After you go through this exercise, we’ll discuss as a group what was wrong with this data and how you would fix it.
- Take about 10 minutes to work on this exercise.
- All the mistakes listed in the next episode are present in the messy dataset. If this exercise is done during a workshop, ask people what they saw as wrong with the data. As they bring up different points, you can refer to the next episode or expand a bit on the point they brought up.
Handy References
Two excellent references on spreadsheet organization are:
Karl W. Broman & Kara H. Woo, Data Organization in Spreadsheets, Vol. 72, Issue 1, 2018, The American Statistician. https://www.tandfonline.com/doi/full/10.1080/00031305.2017.1375989
Hadley Wickham, Tidy Data, Vol. 59, Issue 10, Sep 2014, Journal of Statistical Software. http://www.jstatsoft.org/v59/i10
Metadata
Recording data about your data (“metadata”) is essential. You may be
on intimate terms with your dataset while you are collecting and
analysing it, but the chances that you will still remember the exact
wording of the question you asked about your informants’ water use (the
data recorded in the column water use), for example, are
slim.
As well, there are many reasons other people may want to examine or use your data - to understand your findings, to verify your findings, to review your submitted publication, to replicate your results, to design a similar study, or even to archive your data for access and re-use by others. While digital data by definition are machine-readable, understanding their meaning is a job for human beings. The importance of documenting your data during the collection and analysis phase of your research cannot be overestimated, especially if your research is going to be part of the scholarly record.
However, metadata should not be contained in the data file itself. Unlike a table in a paper or a supplemental file, metadata (in the form of legends) should not be included in a data file since this information is not data, and including it can disrupt how computer programs interpret your data file. Rather, metadata should be stored as a separate file in the same directory as your data file, preferably in plain text format with a name that clearly associates it with your data file. Because metadata files are free text format, they also allow you to encode comments, units, information about how null values are encoded, etc. that are important to document but can disrupt the formatting of your data file.
Some of this information may be familiar to learners who conduct
analyses on survey data or other data sets that come with codebooks.
Codebooks will often describe the way a variable has been constructed,
what prompt was associated with it in an survey or interview, and what
the meaning of various values are. For example, the General Social Survey maintains their
entire codebook online. Looking at an entry for a particular variable,
such as the variable
SEX, provides valuable information about what survey
waves the variable covers, and the meaning of particular values.
Additionally, file or database level metadata describes how files that make up the dataset relate to each other; what format are they are in; and whether they supersede or are superseded by previous files. A folder-level readme.txt file is the classic way of accounting for all the files and folders in a project.
Metadata are most useful when they follow a standard. For example, the Data Documentation Initiative (DDI) provides a standardized way to document metadata at various points in the research cycle. Research librarians may have specific expertise in this area, and can be helpful resources for thinking about ways to purposefully document metatdata as part of your research.
(Text on metadata adapted from the online course Research Data MANTRA by EDINA and Data Library, University of Edinburgh. MANTRA is licensed under a Creative Commons Attribution 4.0 International License.)
Exercise
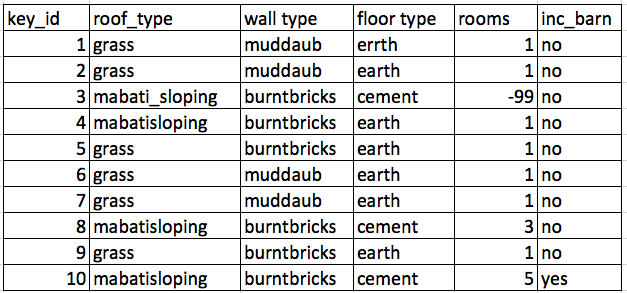
Download a clean version of this dataset and open the file with your spreadsheet program. This data has many more variables that were not included in the messy spreadsheet and is formatted according to tidy data principles.
Discuss this data with a partner and make a list of some of the types of metadata that should be recorded about this dataset. It may be helpful to start by asking yourself, “What is not immediately obvious to me about this data? What questions would I need to know the answers to in order to analyze and interpret this data?”
Some types of metadata that should be recorded and made available with the data are:
- the exact wording of questions used in the interviews (if interviews were structured) or general prompts used (if interviews were semi-structured)
- a description of the type of data allowed in each column (e.g. the allowed range for numerical data with a restricted range, a list of allowed options for categorical variables, whether data in a numerical column should be continuous or discrete)
- definitions of any categorical variables (e.g. definitions of “burntbricks” and “sunbricks”)
- definitions of what was counted as a “room”, a “plot”, etc. (e.g. was there a minimum size)
- learners may come up with additional questions to add to this list
Content from Formatting Problems
Last updated on 2023-05-03 | Edit this page
Overview
Questions
- What are some common challenges with formatting data in spreadsheets and how can we avoid them?
Objectives
- Recognize and resolve common spreadsheet formatting problems.
Common Spreadsheet Errors
This lesson is meant to be used as a reference for discussion as learners identify issues with the messy dataset discussed in the previous lesson. Instructors: don’t go through this lesson except to refer to responses to the exercise in the previous lesson.
There are a few potential errors to be on the lookout for in your own data as well as data from collaborators or the Internet. If you are aware of the errors and the possible negative effect on downstream data analysis and result interpretation, it might motivate yourself and your project members to try and avoid them. Making small changes to the way you format your data in spreadsheets, can have a great impact on efficiency and reliability when it comes to data cleaning and analysis.
- Using multiple tables
- Using multiple tabs
- Not filling in zeros
- Using problematic null values
- Using formatting to convey information
- Using formatting to make the data sheet look pretty
- Placing comments or units in cells
- Entering more than one piece of information in a cell
- Using problematic field names
- Using special characters in data
Using multiple tables
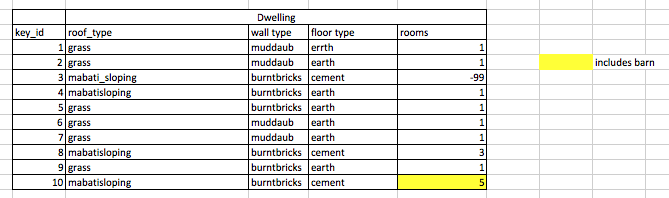
A common strategy is creating multiple data tables within one spreadsheet. This confuses the computer, so don’t do this! When you create multiple tables within one spreadsheet, you’re drawing false associations between things for the computer, which sees each row as an observation. You’re also potentially using the same field name in multiple places, which will make it harder to clean your data up into a usable form. The example below depicts the problem:
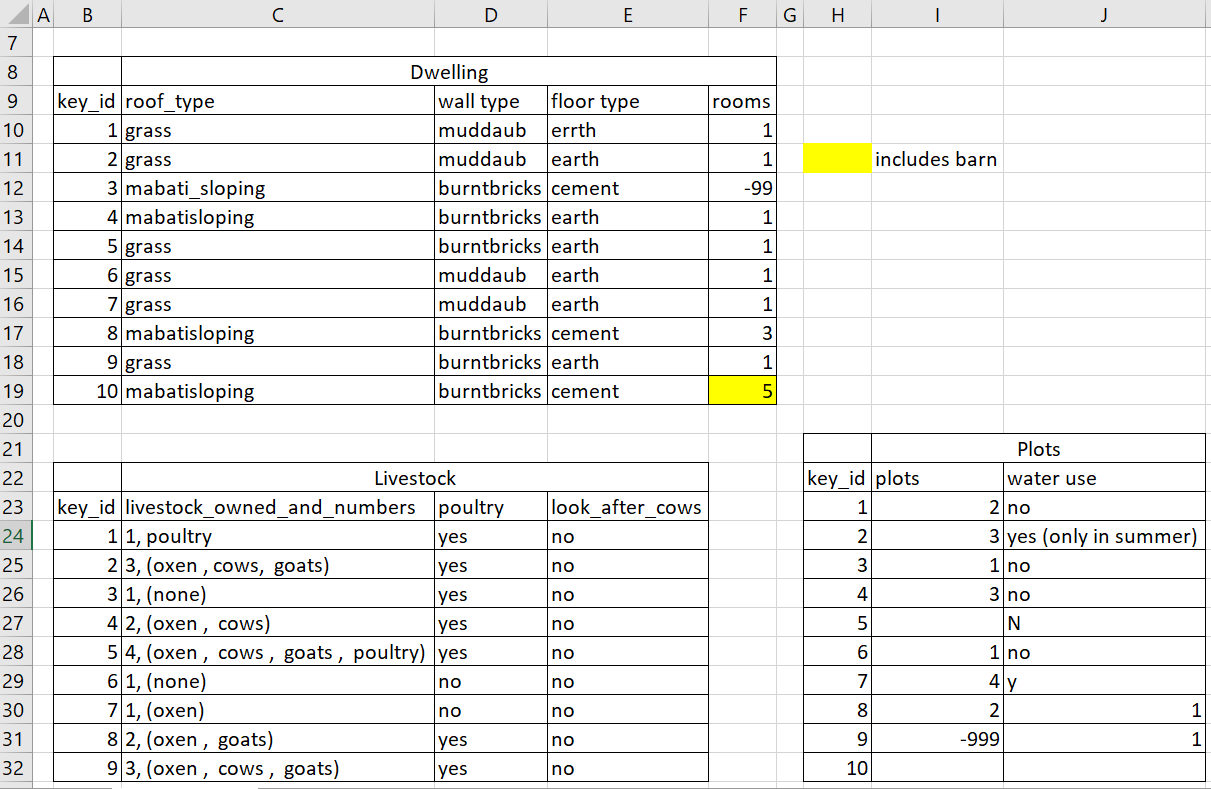
In the example above, the computer will see (for example) row 24 and assume that all columns A-J refer to the same sample. This row actually represents two distinct samples (information about livestock for informant 1 and information about plots for informant 2). Other rows are similarly problematic.
Using multiple tabs
But what about workbook tabs? That seems like an easy way to organize data, right? Well, yes and no. When you create extra tabs, you fail to allow the computer to see connections in the data that are there (you have to introduce spreadsheet application-specific functions or scripting to ensure this connection). Say, for instance, you make a separate tab for each day you take a measurement.
This isn’t good practice for two reasons:
- you are more likely to accidentally add inconsistencies to your data if each time you take a measurement, you start recording data in a new tab, and
- even if you manage to prevent all inconsistencies from creeping in, you will add an extra step for yourself before you analyze the data because you will have to combine these data into a single datatable. You will have to explicitly tell the computer how to combine tabs - and if the tabs are inconsistently formatted, you might even have to do it manually.
For these and other reasons, it is good practice to avoid creating new tabs to organize your spreadsheet data. The next time you’re entering data, and you go to create another tab or table, ask yourself if you could avoid adding this tab by adding another column to your original spreadsheet. You may, however, use a new tab to store notes about your data, such as steps you’ve taken to clean or manipulate your data.
Your data sheet might get very long over the course of the experiment. This makes it harder to enter data if you can’t see your headers at the top of the spreadsheet. But don’t repeat your header row. These can easily get mixed into the data, leading to problems down the road.
Instead you can freeze the column headers so that they remain visible even when you have a spreadsheet with many rows.
Not filling in zeros
It might be that when you’re measuring something, it’s usually a zero, say the number of cows that an informant has, in a region where most farmers have goats and no cows. Why bother writing in the number zero in that column, when it’s mostly zeros?
However, there’s a difference between a zero and a blank cell in a spreadsheet. To the computer, a zero is actually data. You measured or counted it. A blank cell means that it wasn’t measured and the computer will interpret it as an unknown value (otherwise known as a null value).
The spreadsheets or statistical programs will likely mis-interpret blank cells that you intend to be zeros. By not entering the value of your observation, you are telling your computer to represent that data as unknown or missing (null). This can cause problems with subsequent calculations or analyses. For example, the average of a set of numbers which includes a single null value is always null (because the computer can’t guess the value of the missing observations). Because of this, it’s very important to record zeros as zeros and truly missing data as nulls.
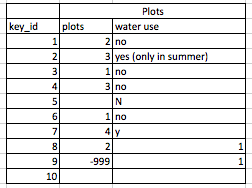
Using problematic null values
Example: using -999 or other numerical values (or zero) to represent missing data.
Solution: One common practice is to record unknown or missing data as -999, 999, or 0. Many statistical programs will not recognize that these are intended to represent missing (null) values. How these values are interpreted will depend on the software you use to analyze your data. It is essential to use a clearly defined and consistent null indicator. Blanks (most applications) and NA (for R) are good choices. White et al, 2013, explain good choices for indicating null values for different software applications in their article: Nine simple ways to make it easier to (re)use your data. Ideas in Ecology and Evolution.
| Null Values | Problems | Compatibility | Recommendation |
|---|---|---|---|
| 0 | Indistinguishable from a true zero | NEVER use | |
| Blank | Hard to distinguish values that are missing from those overlooked on entry. Hard to distinguish blanks from spaces, which behave differently. | R, Python, SQL, Excel | Best option |
| -999, 999 | Not recognized as null by many programs without user input. Can be inadvertently entered into calculations. | Avoid | |
| NA, na | Can also be an abbreviation (e.g., North America), can cause problems with data type (turn a numerical column into a text column). NA is more commonly recognized than na. | R | Good option |
| N/A | An alternate form of NA, but often not compatible with software. | Avoid | |
| NULL | Can cause problems with data type. | SQL | Good option |
| None | Uncommon. Can cause problems with data type. | Python | Avoid |
| No data | Uncommon. Can cause problems with data type, contains a space. | Avoid | |
| Missing | Uncommon. Can cause problems with data type. | Avoid | |
| -, +, . | Uncommon. Can cause problems with data type. | Avoid |
Using formatting to convey information
Example: highlighting cells, rows or columns that should be excluded from an analysis, leaving blank rows to indicate separations in data.
Solution: create a new field to encode which data should be excluded.
Using formatting to make the data sheet look pretty {#formatting-pretty}
Example: merging cells.
Solution: If you’re not careful, formatting a worksheet to be more aesthetically pleasing can compromise your computer’s ability to see associations in the data. Merged cells will make your data unreadable by statistics software. Consider restructuring your data in such a way that you will not need to merge cells to organize your data.
Placing comments or units in cells
Example: Some of your informants only irrigate their plots at certain times of the year. You’ve added this information as notes directly into the cell with the data.
Solution: Most analysis software can’t see Excel or LibreOffice comments, and would be confused by comments placed within your data cells. As described above for formatting, create another field if you need to add notes to cells. Similarly, don’t include units in cells: ideally, all the measurements you place in one column should be in the same unit, but if for some reason they aren’t, create another field and specify the units the cell is in.
Entering more than one piece of information in a cell
Example: Your informant has multiple livestock of different types. You record this information as “3, (oxen , cows)” to indicate that there are three total livestock, which is a mixture of oxen and cows.
Solution: Don’t include more than one piece of information in a cell. This will limit the ways in which you can analyze your data. If you need both these types of information (the total number of animals and the types), design your data sheet to include this information. For example, include a separate column for each type of livestock.
Using problematic field names {#field-name}
Choose descriptive field names, but be careful not to include spaces, numbers, or special characters of any kind. Spaces can be misinterpreted by parsers that use whitespace as delimiters and some programs don’t like field names that are text strings that start with numbers.
Underscores (_) are a good alternative to spaces.
Consider writing names in camel case (like this: ExampleFileName) to
improve readability. Remember that abbreviations that make sense at the
moment may not be so obvious in 6 months, but don’t overdo it with names
that are excessively long. Including the units in the field names avoids
confusion and enables others to readily interpret your variable names.
Avoid starting variable names with numbers, as this may cause problems
with some analysis software.
Examples
| Good Name | Good Alternative | Avoid |
| wall_type | WallType | wall type |
| longitude | GpsLongitude | gps:Longitude |
| gender | gender | M/F |
| Informant_01 | first_informant | 1st Inf |
| age_18 | years18 | 18years |
Using special characters in data
Example: You treat your spreadsheet program as a word processor when writing notes, for example copying data directly from Word or other applications.
Solution: This is a common strategy. For example, when writing longer text in a cell, people often include line breaks, em-dashes, etc in their spreadsheet. Also, when copying data in from applications such as Word, formatting and fancy non-standard characters (such as left- and right-aligned quotation marks) are included. When exporting this data into a coding/statistical environment or into a relational database, dangerous things may occur, such as lines being cut in half and encoding errors being thrown.
General best practice is to avoid adding characters such as newlines, tabs, and vertical tabs. In other words, treat a text cell as if it were a simple web form that can only contain text and spaces.
Key Points
- Avoid using multiple tables within one spreadsheet.
- Avoid spreading data across multiple tabs (but do use a new tab to record data cleaning or manipulations).
- Record zeros as zeros.
- Use an appropriate null value to record missing data.
- Don’t use formatting to convey information or to make your spreadsheet look pretty.
- Place comments in a separate column.
- Record units in column headers.
- Include only one piece of information in a cell.
- Avoid spaces, numbers and special characters in column headers.
- Avoid special characters in your data.
Content from Dates as Data
Last updated on 2023-05-03 | Edit this page
Overview
Questions
- What are good approaches for handling dates in spreadsheets?
Objectives
- Recognise problematic or suspicious date formats.
- Use formulas to separate dates into their component values (e.g. Month, Day, Year).
Date formats in spreadsheets
Dates in spreadsheets are often stored in a single column.
While this seems like a logical way to record dates when you are entering them, or visually reviewing data, it’s not actually a best practice for preparing data for analysis.
When working with data, your goal is to have as little ambiguity as possible. Ambiguity can creep into your data when working with dates when there are regional variations either in your observations and when you or your team might be working with different versions or suites of software products (e.g., LibreOffice, Microsoft Excel, Gnumeric).
To avoid ambiguity between regional differences in date formatting and compatibility across spreadsheet software programs, a good practice is to divide dates into components in different columns - DAY, MONTH, and YEAR.
When working with dates it’s also important to remember that functions are guaranteed to be compatible only within the same family of software products (e.g., LibreOffice, Microsoft Excel, Gnumeric). If you need to export your data and conserve the timestamps, you are better off handling dates using one of the solutions discussed below than the single column method.
One of the other reasons dates can be tricky is that most spreadsheet programs have “useful features” which can change the way dates are displayed - but not stored. The image below demonstrates some of the many date formatting options in Excel.
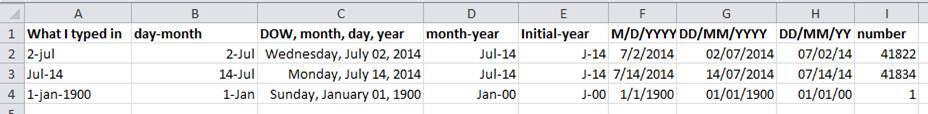
Dates stored as integers
The first thing you need to know is that Excel stores dates as numbers - see the last column in the above figure. This serial number represents the number of days from December 31, 1899. In the example, July 2, 2014 is stored as the serial number 41822.
Excel’s date systems
Excel also entertains a second date system, the 1904 date system, as the default in Excel for Macintosh. This system will assign a different serial number than the 1900 date system. Because of this, dates must be checked for accuracy when exporting data from Excel (look for dates that are ~4 years off).
Using functions we can add days, months or years to a given date. Say you had a research plan where you needed to conduct interviews with a set of informants every ninety days for a year.
In our example above, in a new cell you can type:
=B2+90
And it would return
30-Sep
because it understands the date as a number 41822, and
41822 + 90 = 41912 which Excel interprets as the 30th day
of September, 2014. In most cases, it retains the format of the cell
that is being operated upon. Month and year rollovers are internally
tracked and applied.
Regional date formatting
When you enter a date into a spreadsheet it looks like a date although the spreadsheet program may display different text from what you input. It does this to be ‘helpful’ but it often is not.
For example if you enter ‘7/12/88’ into your Excel spreadsheet it may display as ‘07/12/1988’ (depending on your version of Excel). These are different ways of formatting the same date.
Different countries also write dates differently. If you are in the UK, for example, you will interpret the date above as the 7th day of December, however a researcher from the US will interpret the same entry as the 12th day of July. This regional variation is handled automatically by your spreadsheet program so that when you are typing in dates they appear as you would expect. If you try to type in a US format date into a UK version of Excel, it may or may not be treated as a date.
This regional variation is one good reason to treat dates, not as a single data point, but as three distinct pieces of data (month, day, and year). Separating dates into their component parts will avoid this confusion, while also giving the added benefit of allowing you to compare, for example data collected in January of multiple years with data collected in February of multiple years.
Separating dates into components
Download and open the SAFI_dates.xlsx file. This file contains a subset of the data from the SAFI interviews, including the dates on which the interviews were conducted.
Choose the tab of the spreadsheet that corresponds to the way you
format dates in your location (either day first DD_MM_YEAR,
or month first MM_DD_YEAR).
Extract the components of the date to new columns. For this we can use the built in Excel functions:
=MONTH()=DAY()=YEAR()
Apply each of these formulas to its entire column. Make sure the new column is formatted as a number and not as a date.
We now have each component of our date isolated in its own column. This will allow us to group our data with respect to month, year, or day of month for our analyses and will also prevent problems when passing data between different versions of spreadsheet software (as for example when sharing data with collaborators in different countries).
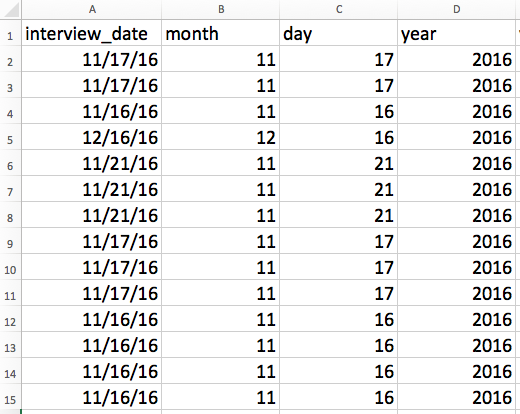
Note that this solution shows the dates in MM_DD_YEAR
format.
Default year
Using the same spreadsheet you used for the previous exercise, add
another data point in the interview_date column by typing
either 11/17 (if your location uses MM/DD
formatting) or 17/11 (if your location uses
DD/MM formatting). The Day,
Month, and Year columns should populate for
this new data point. What year is shown in the Year
column?
If no year is specified, the spreadsheet program will assume you mean the current year and will insert that value. This may be incorrect if you are working with historical data so be very cautious when working with data that does not have a year specified within its date variable.
Historical data
Excel is unable to parse dates from before 1899-12-31, and will thus leave these untouched. If you’re mixing historic data from before and after this date, Excel will translate only the post-1900 dates into its internal format, thus resulting in mixed data. If you’re working with historic data, be extremely careful with your dates!
Content from Quality Assurance
Last updated on 2023-05-03 | Edit this page
Overview
Questions
- How can we carry out basic quality assurance in spreadsheets?
Objectives
- Apply quality assurance techniques to limit incorrect data entry.
When you have a well-structured data table, you can use several simple techniques within your spreadsheet to ensure the data you enter is free of errors.
Validating data on input
When we input data into a cell of a spreadsheet we are typically not constrained in the type of data we enter. In any one column, the spreadsheets software will not warn us if we start to enter a mix of text, numbers or dates in different rows. Even if we are not facing constraints from the software, as a researcher we often anticipate that all data in one column will be of a certain type. It is also possible that the nature of the data contained in the table allows us to place additional restrictions on the acceptable values for cells in a column. For example a column recording age in years should be numeric, greater than 0 and is unlikely to be greater than 120.
Excel allows us to specify a variety of data validations to be applied to cell contents. If the validation fails, an error is raised and the data we entered does not go into the particular cell. In addition to providing validation when we enter data, Excel allows us to add validations to data that has already been entered. The validation is not applied retrospectively, so that data are removed. Instead, if a particular cell would fail the validation check a triangle is placed in the top left corner of the cell as a warning.
We will be working with a couple of examples of data validation rules but many others exist. For an overview of data validation rules available in Excel, check out the Excel support page on data validation.
We will look at two examples:
- Restricting data to a numeric range
- Restricting data to entries from a list
Restricting data to a numeric range
Looking again at the clean version of
the SAFI dataset, we see that there are several columns with numeric
data. One example of this is the column no_membrs
representing the number of people in the household. We would expect this
always to be a positive integer, and so we should reject values like
1.5 and -8 as entry errors. We would also
reject values over a certain maximum - for example an entry like
90 is probably the result of the researcher inputting
9 and their finger slipping and also hitting the
0 key. It is up to you as the researcher to decide what a
reasonable maximum value would be for your data, here we will assume
that there are no families with greater than 30 members.
1. Select the no_membrs column.
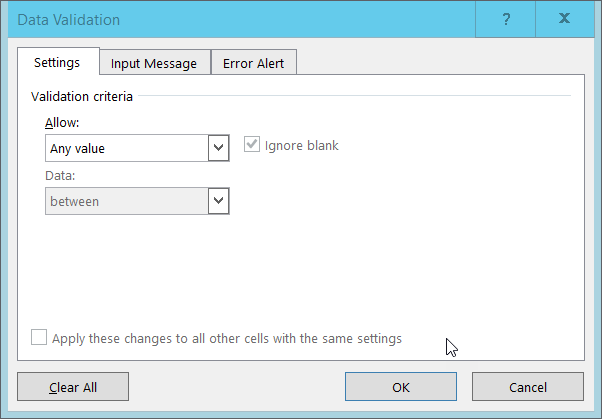
2. In Excel on the Data tab select
Data Tools and then Data Validation or
Validation Tools (depending on your version of Excel). The
following popout will appear:
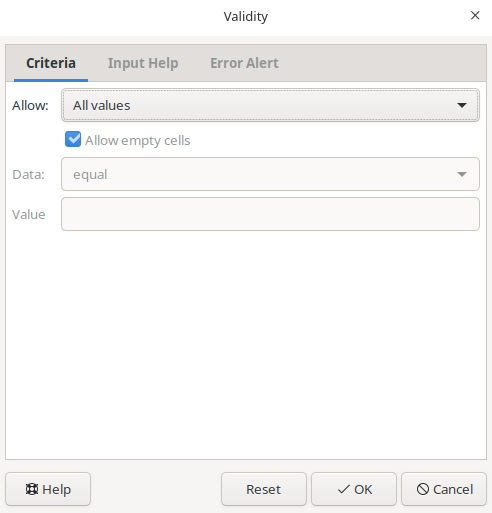
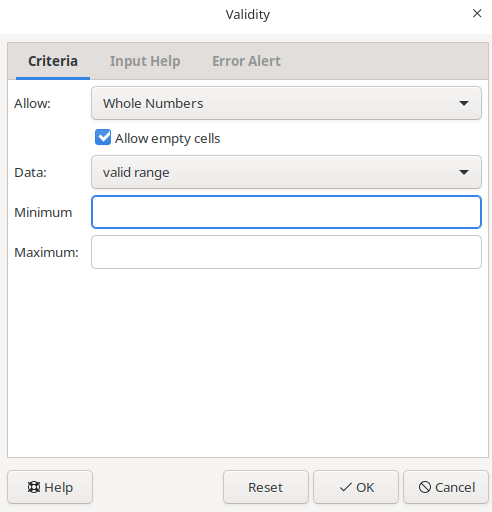
In Libre Office on the Data tab select
Validity... the following popup will appear:
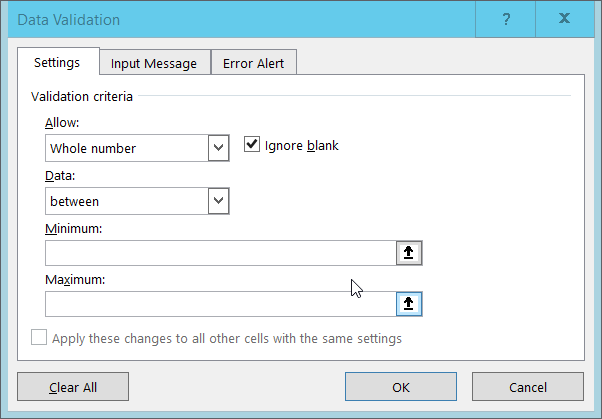
3. In Excel, select ‘Whole number’ from the Allow drop
down options.
In Libre Office choose Allow: Whole Numbers and then
Data: valid range.
4. The window content will change. The value in the data box will say
‘between’ and Minimum and Maximum boxes will
be provided for you to specify an allowed range. In Excel you will
see:
In LibreOffice, you will see:
5. Fill in the minimum and maximum values that make sense for your
data and click Ok. Here we will choose a minimum of 1 and a
maximum of 30.
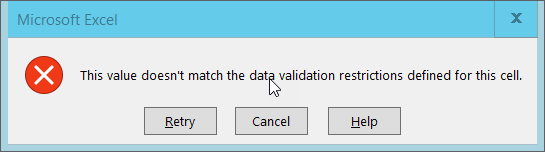
Your data table will now not allow you to enter a value that violates
the data validation rule you have created. To test this out, try to
enter a new value into the no_membrs column that is not
valid. The following error box will appear in Excel:
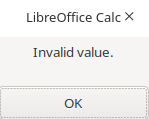
The following error box will appear in LibreOffice:
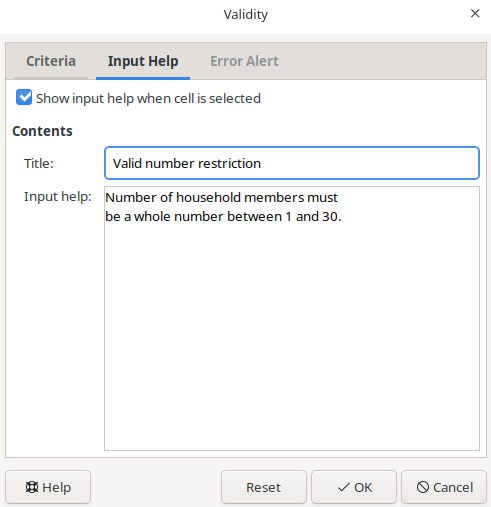
You can also customize the resulting message to be more informative
by entering your own message in the Input Message tab when
creating a data validation rule. In Excel, you will see:
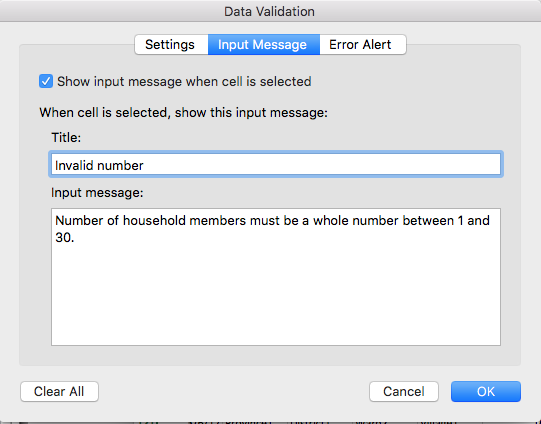
In LibreOffice, you will see:
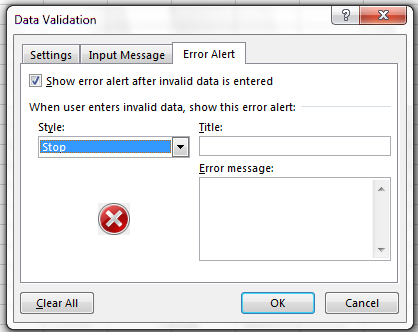
You can also allow invalid data to result in a warning rather than an
error by modifying the Style option on the
Error Alert tab. For Excel you will see:
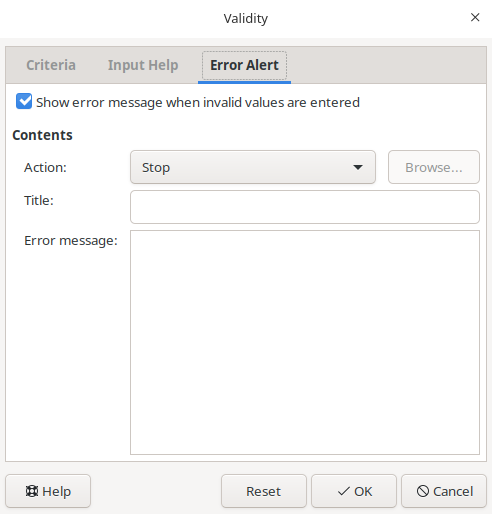
In LibreOffice, you will see:
Restricting data to entries from a list
Quality assurance can make data entry easier as well as more robust. For example, if you use a list of options to restrict data entry, the spreadsheet will provide you with a drop-downlist of the available items. So, instead of trying to remember how to spell “mabatisloping”, or whether or not you capitalized “cement” you can select the right option from the list.
1. Select the respondent_wall_type column.
2. In Excel, on the Data tab select
Data Tools and then Data Validation or
Validation Tools (depending on your version of Excel). The
following popout will appear:
In LibreOffice, on the Data tab select
Validity...
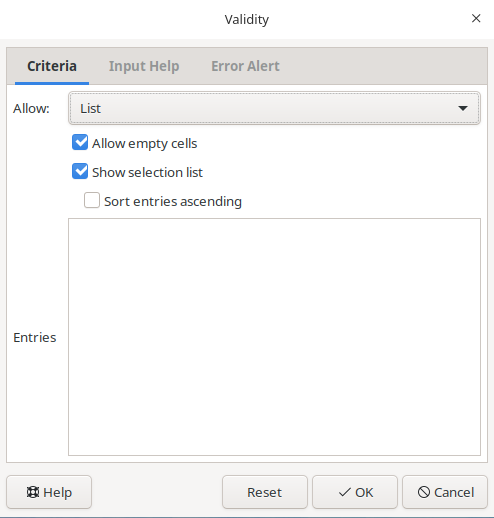
3. In Excel, select List from the Allow
drop-down menu, and in LibreOffice, choose the List
option.
4. In Excel, the window will change to include a Source
box, you will see,

In LibreOffice, you will see,
5. Type a list of all the values that you want to be accepted in this column, separated by a comma (with no spaces). For us this will be “grass, muddaub, burntbricks, sunbricks, cement”.
In LibreOffice, your entries of grass, muddaub, burntbricks, sunbricks and cement should be on new lines as shown below
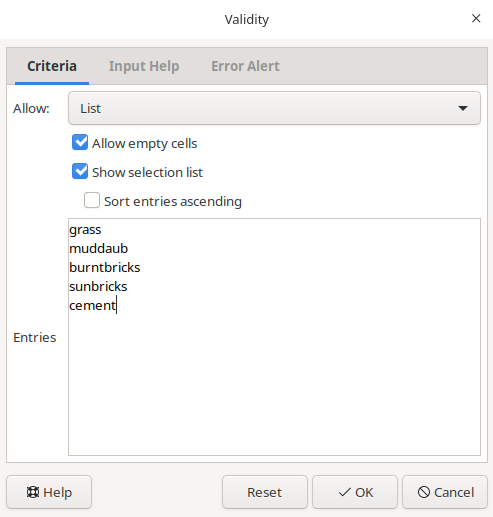
6. In Excel, create a meaningful input message, then click OK. In LibreOffice, there is no need to create an input message.
We have now provided a restriction that will be validated each time we try and enter data into the selected cells. When a cell in this column is selected, a drop-down arrow will appear. When you click the arrow, you will be able to select a value from your list. If you type a value which is not on the list, you will get an error message. This not only prevents data input errors, but also makes it easier and faster to enter data.
Tip
Typing a list of values where only a few possible values exist (like “grass, muddaub, burntbricks, sunbricks, cement”) might be convenient, but if the list is longer it makes sense to create it as a small table (in a separate tab of the workbook). We can give the table a name and then reference the table name as the source of acceptable inputs when the source box appears in the Data Validation pop-out.
Using a table in this way makes the data entry process more flexible. If you add or remove contents from the table, then these are immediately reflected in any new cell entries based on this source. You can also have different cells refer to the same table of acceptable inputs.
Tip
In the examples above we have applied data validation rules to an
existing spreadsheet to demonstrate how they work, however, you may have
noticed that data validation rules are not applied retroactively to data
that is already present in the cell. This means, for example, that if we
had already entered 150 in the no_membrs
column before applying our data validation rule, that cell would not be
flagged with a warning.
In some versions of Excel, you can click in the Data tab
on Data Validation and then
Circle invalid data. This will put red circles around
invalid data entries. Note that it can be a bit slow with large data
files.
When using spreadsheets for data entry, it is a good idea to set up data validation rules for each column when you set up your spreadsheet (i.e. before you enter any data).
Content from Exporting Data
Last updated on 2023-06-21 | Edit this page
Overview
Questions
- How can we export data from spreadsheets in a way that is useful for downstream applications?
Objectives
- Store spreadsheet data in universal file formats.
- Export data from a spreadsheet to a CSV file.
Storing the data you’re going to work with for your analyses in Excel
default file format (*.xls or *.xlsx -
depending on the Excel version) isn’t a good idea. Why?
Because it is a proprietary format, and it is possible that in the future, technology won’t exist (or will become sufficiently rare) to make it inconvenient, if not impossible, to open the file.
Other spreadsheet software may not be able to open files saved in a proprietary Excel format.
Different versions of Excel may handle data differently, leading to inconsistencies.
Finally, more journals and grant agencies are requiring you to deposit your data in a data repository, and most of them don’t accept Excel format. It needs to be in one of the formats discussed below.
The above points also apply to other formats such as open data formats used by LibreOffice. These formats are not static and do not get parsed the same way by different software packages.
As an example of inconsistencies in data storage, do you remember how we talked about how Excel stores dates earlier? It turns out that there are multiple defaults for different versions of the software, and you can switch between them all. So, say you’re compiling Excel-stored data from multiple sources. There’s dates in each file- Excel interprets them as their own internally consistent serial numbers. When you combine the data, Excel will take the serial number from the place you’re importing it from, and interpret it using the rule set for the version of Excel you’re using. Essentially, you could be adding errors to your data, and it wouldn’t necessarily be flagged by any data cleaning methods if your ranges overlap.
Storing data in a universal, open, and static format will help deal with this problem. Try tab-delimited (tab separated values or TSV) or comma-delimited (comma separated values or CSV). CSV files are plain text files where the columns are separated by commas, hence ‘comma separated values’ or CSV. The advantage of a CSV file over an Excel/SPSS/etc. file is that we can open and read a CSV file using just about any software, including plain text editors like TextEdit or NotePad. Data in a CSV file can also be easily imported into other formats and environments, such as SQLite and R. We’re not tied to a certain version of a certain expensive program when we work with CSV files, so it’s a good format to work with for maximum portability and endurance. Most spreadsheet programs can save to delimited text formats like CSV easily, although they may give you a warning during the file export.
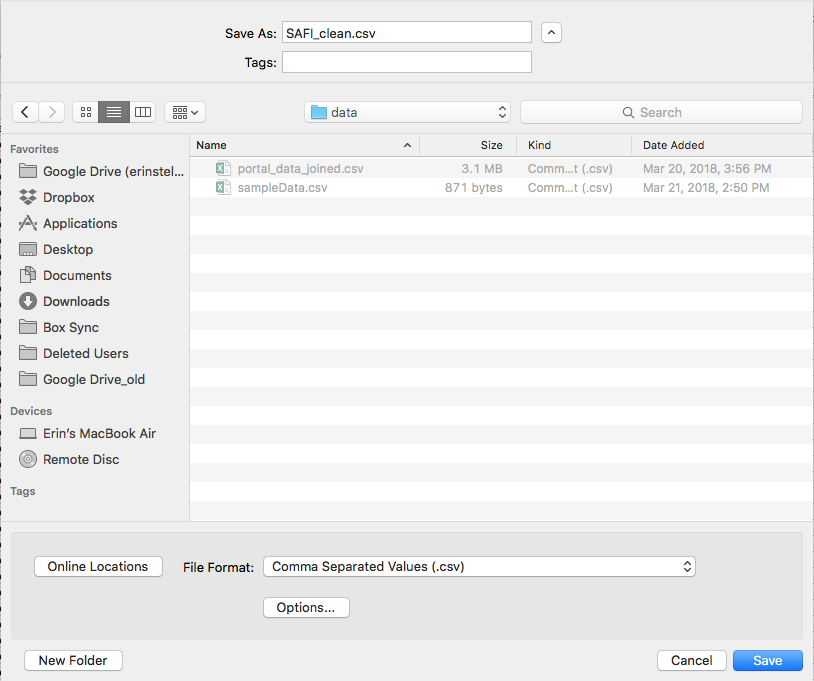
To save a file you have opened in Excel in CSV format:
- From the top menu select
FileandSave as. - In the
Formatfield, from the list, selectComma Separated Values(*.csv). - Double check the file name and the location where you want to save
it and hit
Save.
An important note for backwards compatibility: you can open CSV files in Excel!
A note on R andxls
There are R packages that can read xls files (as well as
Google spreadsheets). It is even possible to access different worksheets
in the xls documents. However, because these packages parse
data tables from proprietary and non-static software, there is no
guarantee that they will continue to work on new versions of Excel.
Exporting your data to CSV or TSV format is much safer and more
reproducible.
What to do when your data contain commas
In some datasets, the data values themselves may include commas (,). In that case, you need to make sure that the commas are properly escaped when saving the file. Otherwise, the software which you use (including Excel) will most likely incorrectly display the data in columns. This is because the commas which are a part of the data values will be interpreted as delimiters.
If you are working with data that contains commas, the fields should be enclosed with double quotes. The spreadsheet software should do the right thing LibreOffice provides comprehensive options to import and export CSV files). However, it is always a good idea to double check that the file you are exporting can be read in correctly. For more of a discussion on data formats and potential issues with commas within datasets see the Ecology Spreadsheets lesson discussion page.