NEON Raster (NEON)
Jane just got a job working to develop data products for NEON. She’s got to familiarize herself with working with LiDAR data and seeks out the great ‘Work with Data’ tutorial for raster data. Help Jane take the next step and develop a few additional products from the LiDAR Dataset
-
Modify the code provided in the tutorial to add the average and minimum values from the Canopy Height Model to the plot centroids data with the maximum values.
-
Add the average, minimum and stem count (
n()) to theinsitu_maxStemHeightsummary (You might consider renaming it to something more appropriate). Do you notice more or less deviation from the LiDAR and field sampling data for the average and minimum canopy height values? What do you think is going on? -
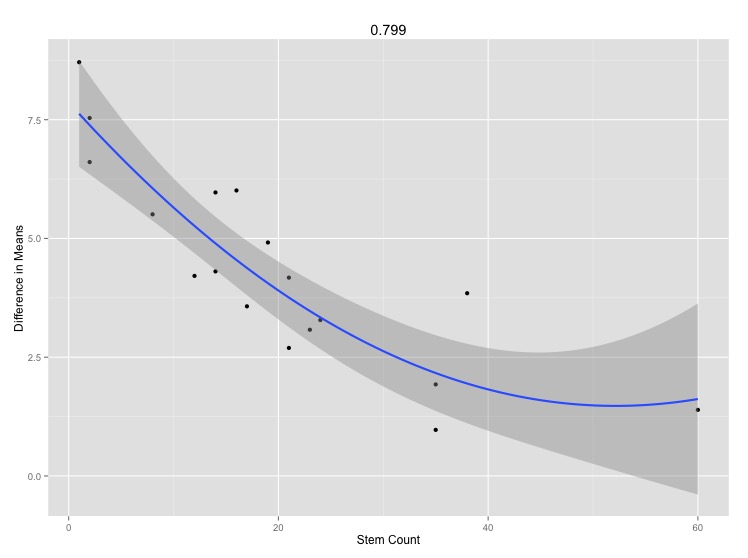
Modify your
insitu...data to include the difference in average canopy height values. Determine values of a linear model and r2 for the
difference in average canopy height values (y) and stem count (x). Does a polynomial (poly(x, 2)) fit better? Plot the data with the best geometric line determined by your models and include the r2 value as the title.