Multi-file Analysis (Loops)
You have a satellite collars on a number of different individuals and want to be able to quickly look at all of their recent movements at once. The data is posted daily to a url as a zip file that contains one csv file for each individual: http://www.datacarpentry.org/semester-biology/data/individual_collar_data.zip Start your solution by:
- If
individual_collar_data.zipis not already in your working directory download the zip file usingdownload.file() - Unzip it using
unzip() - Obtain a list of all of the files with file names matching the pattern
"collar-data-.*.txt"(usinglist.files())
-
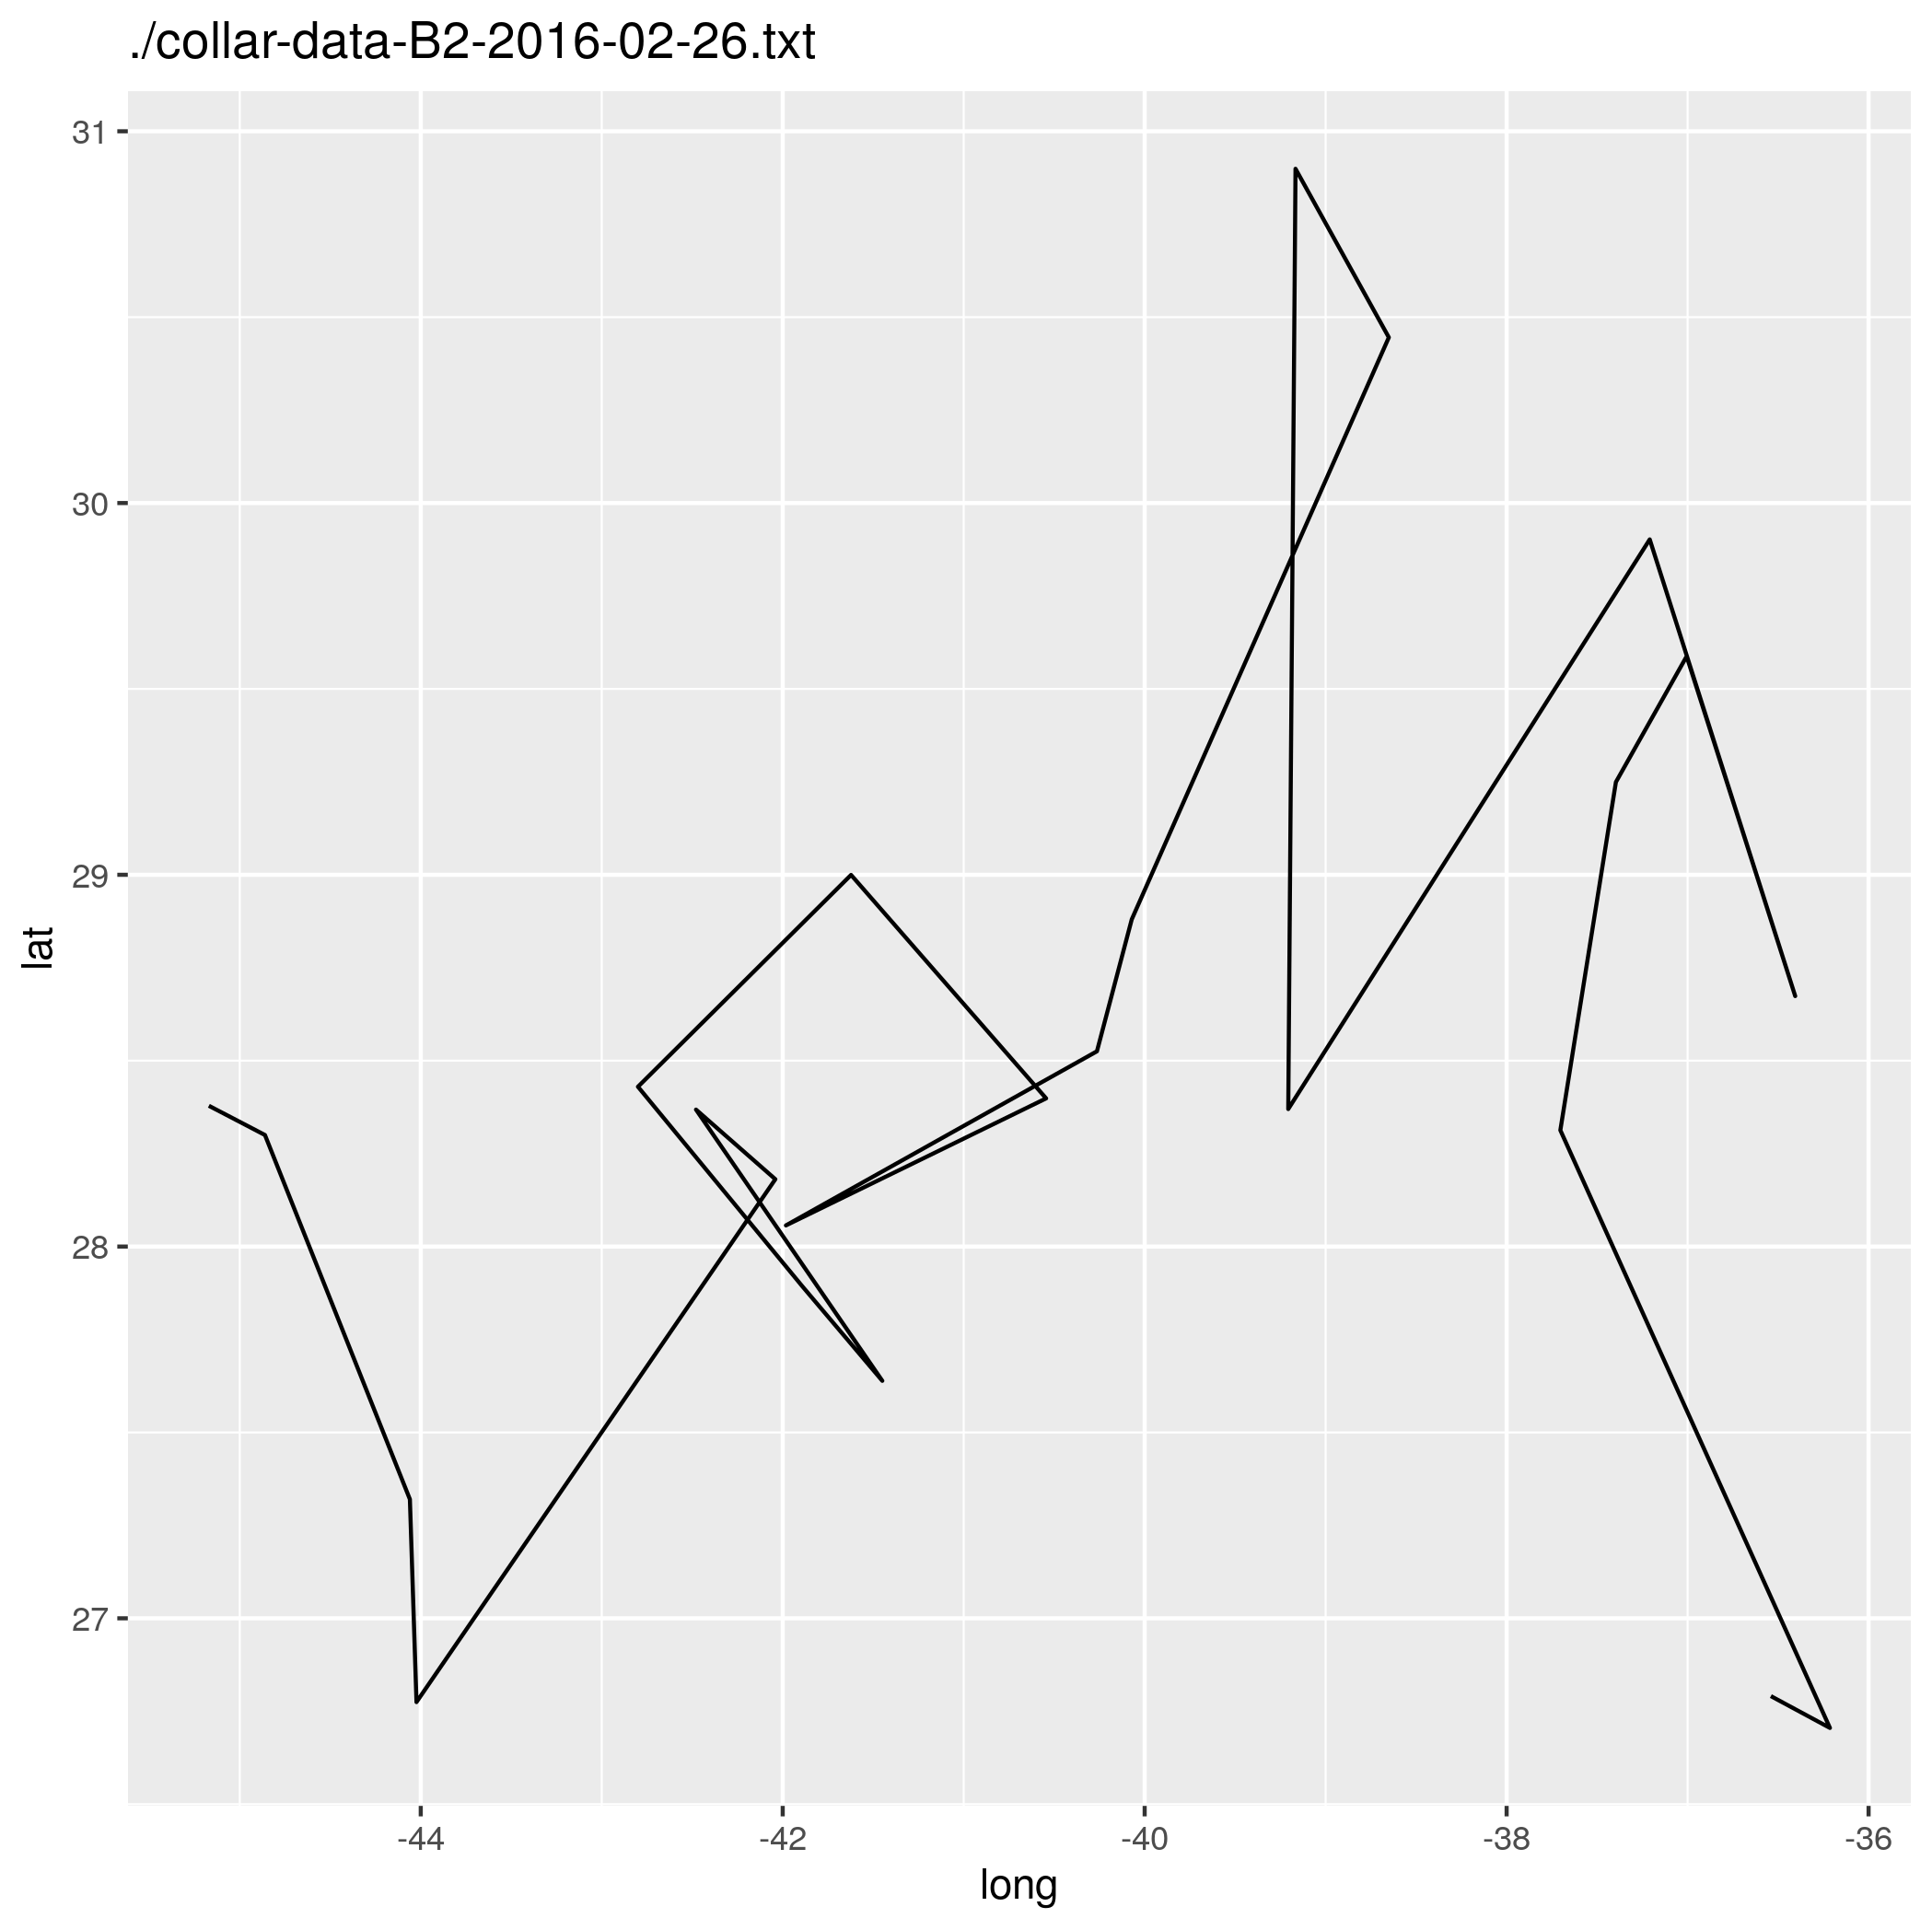
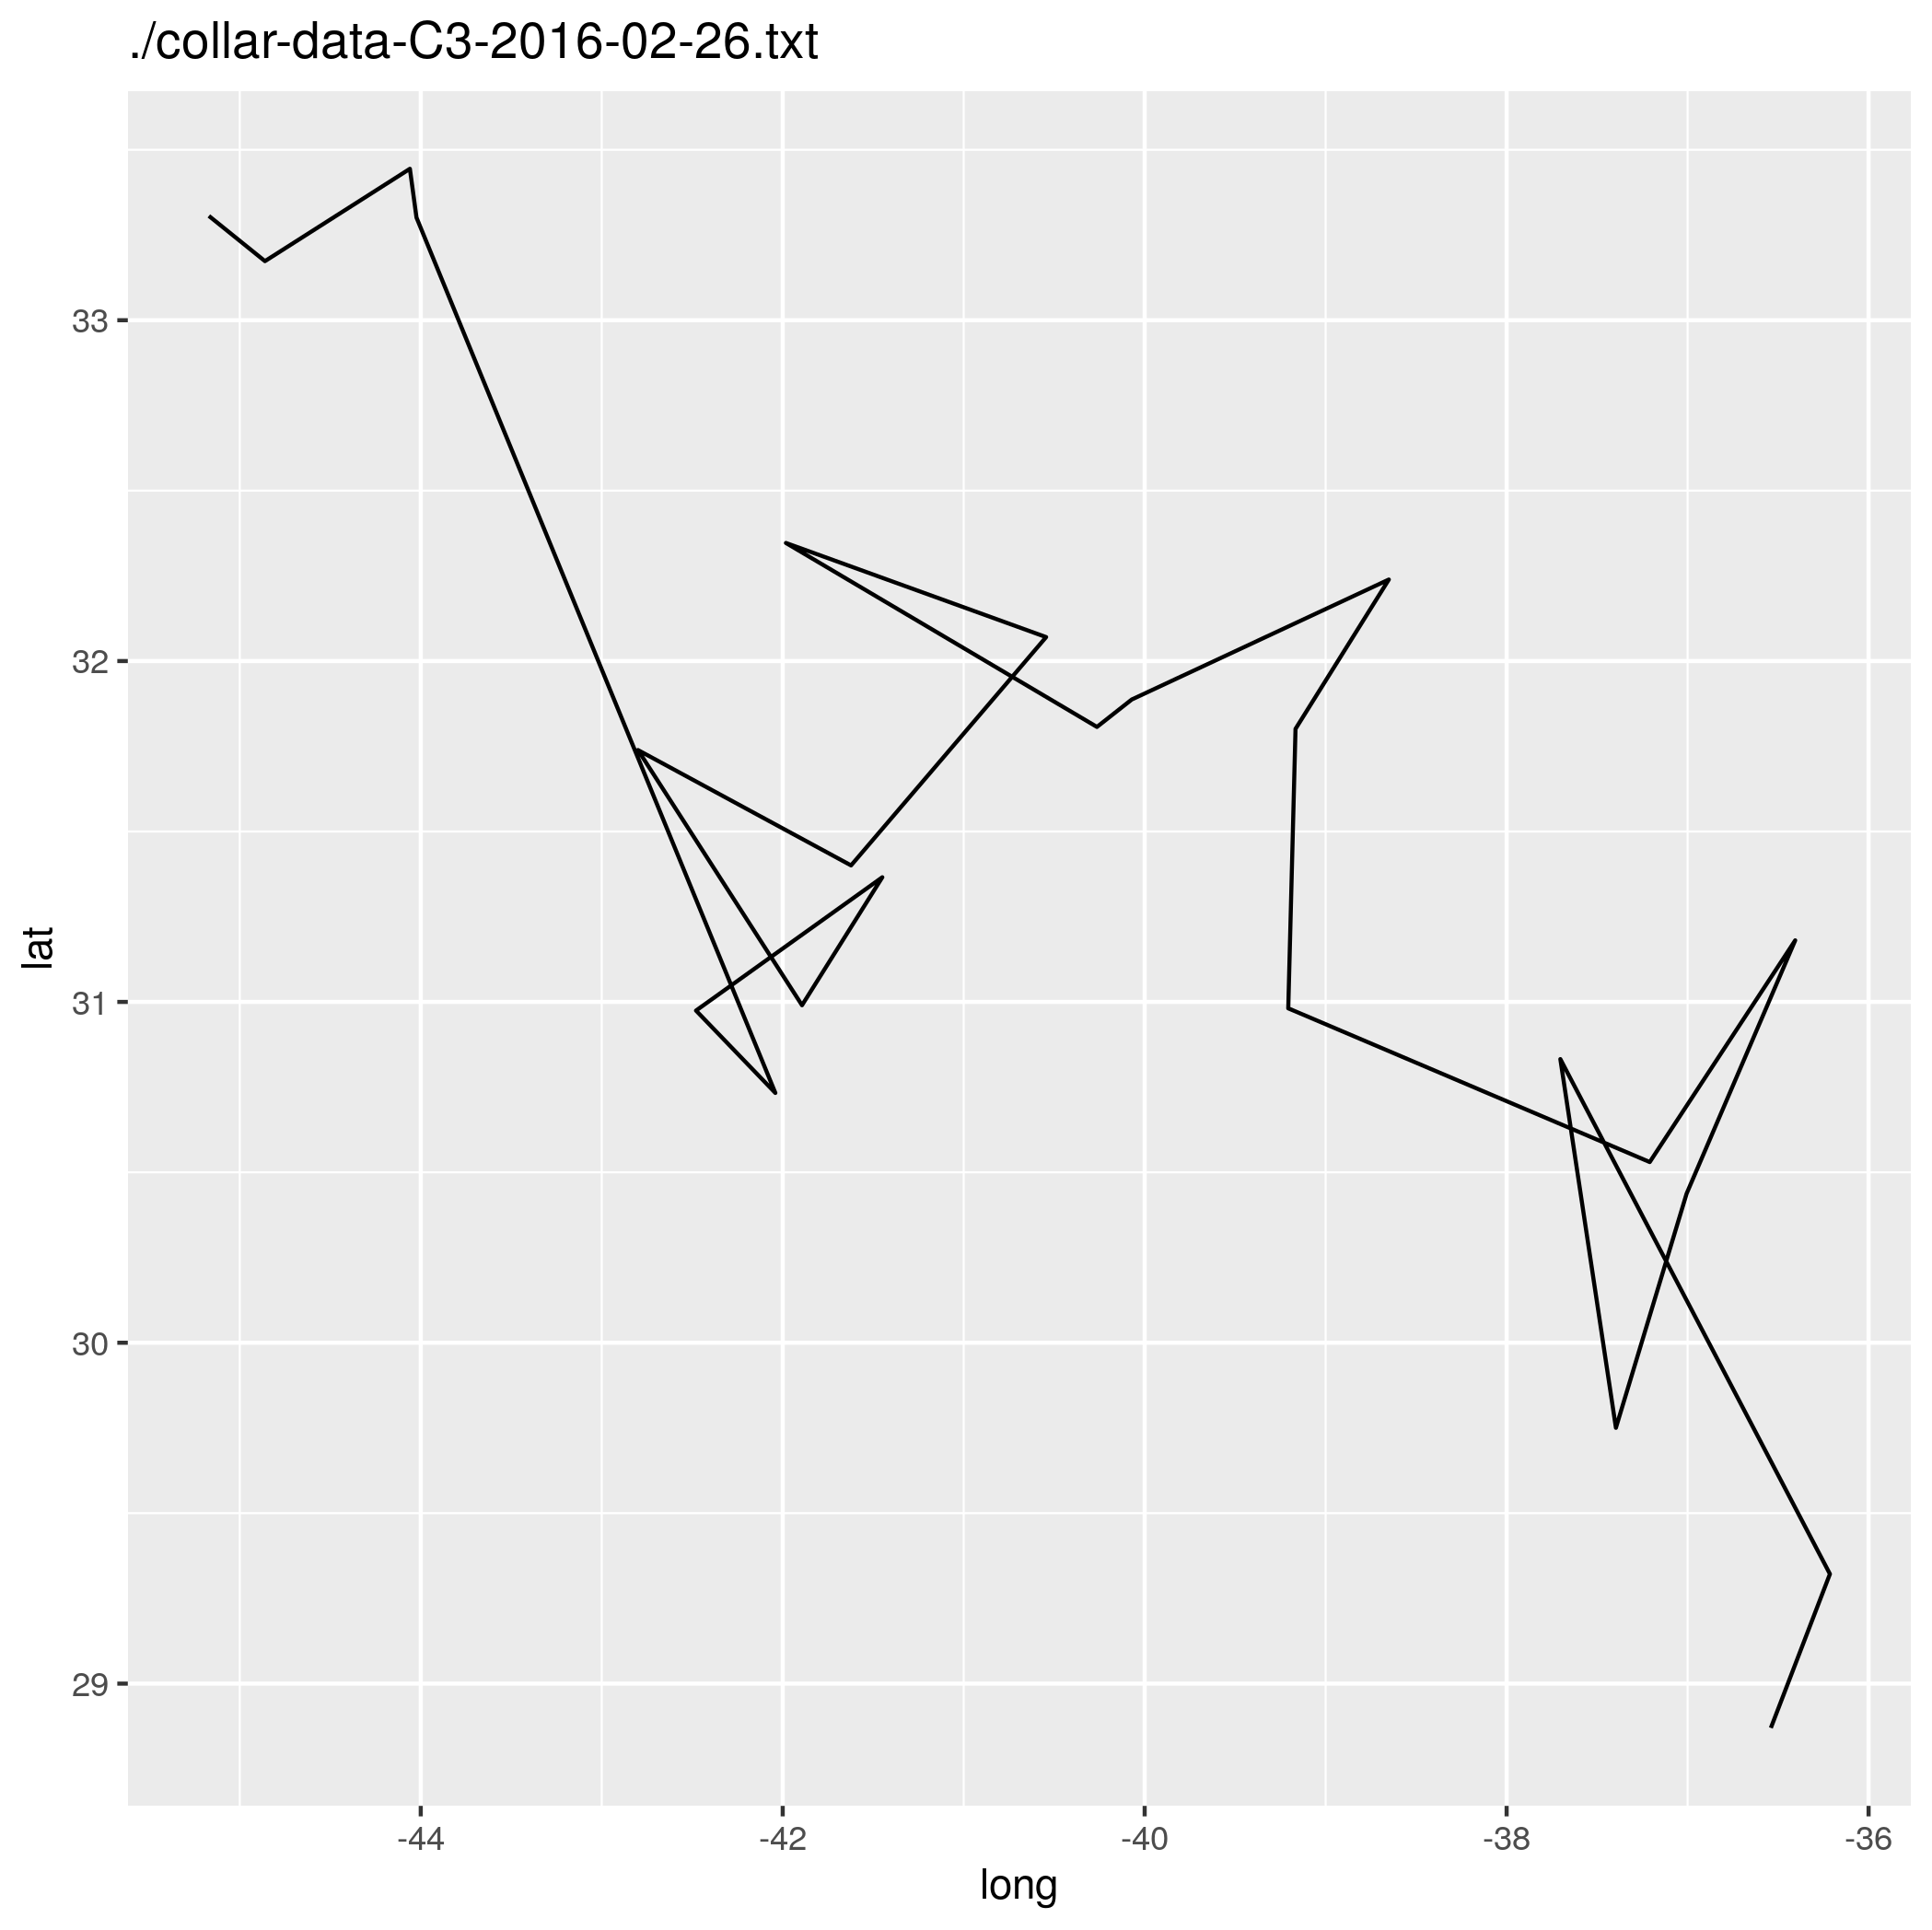
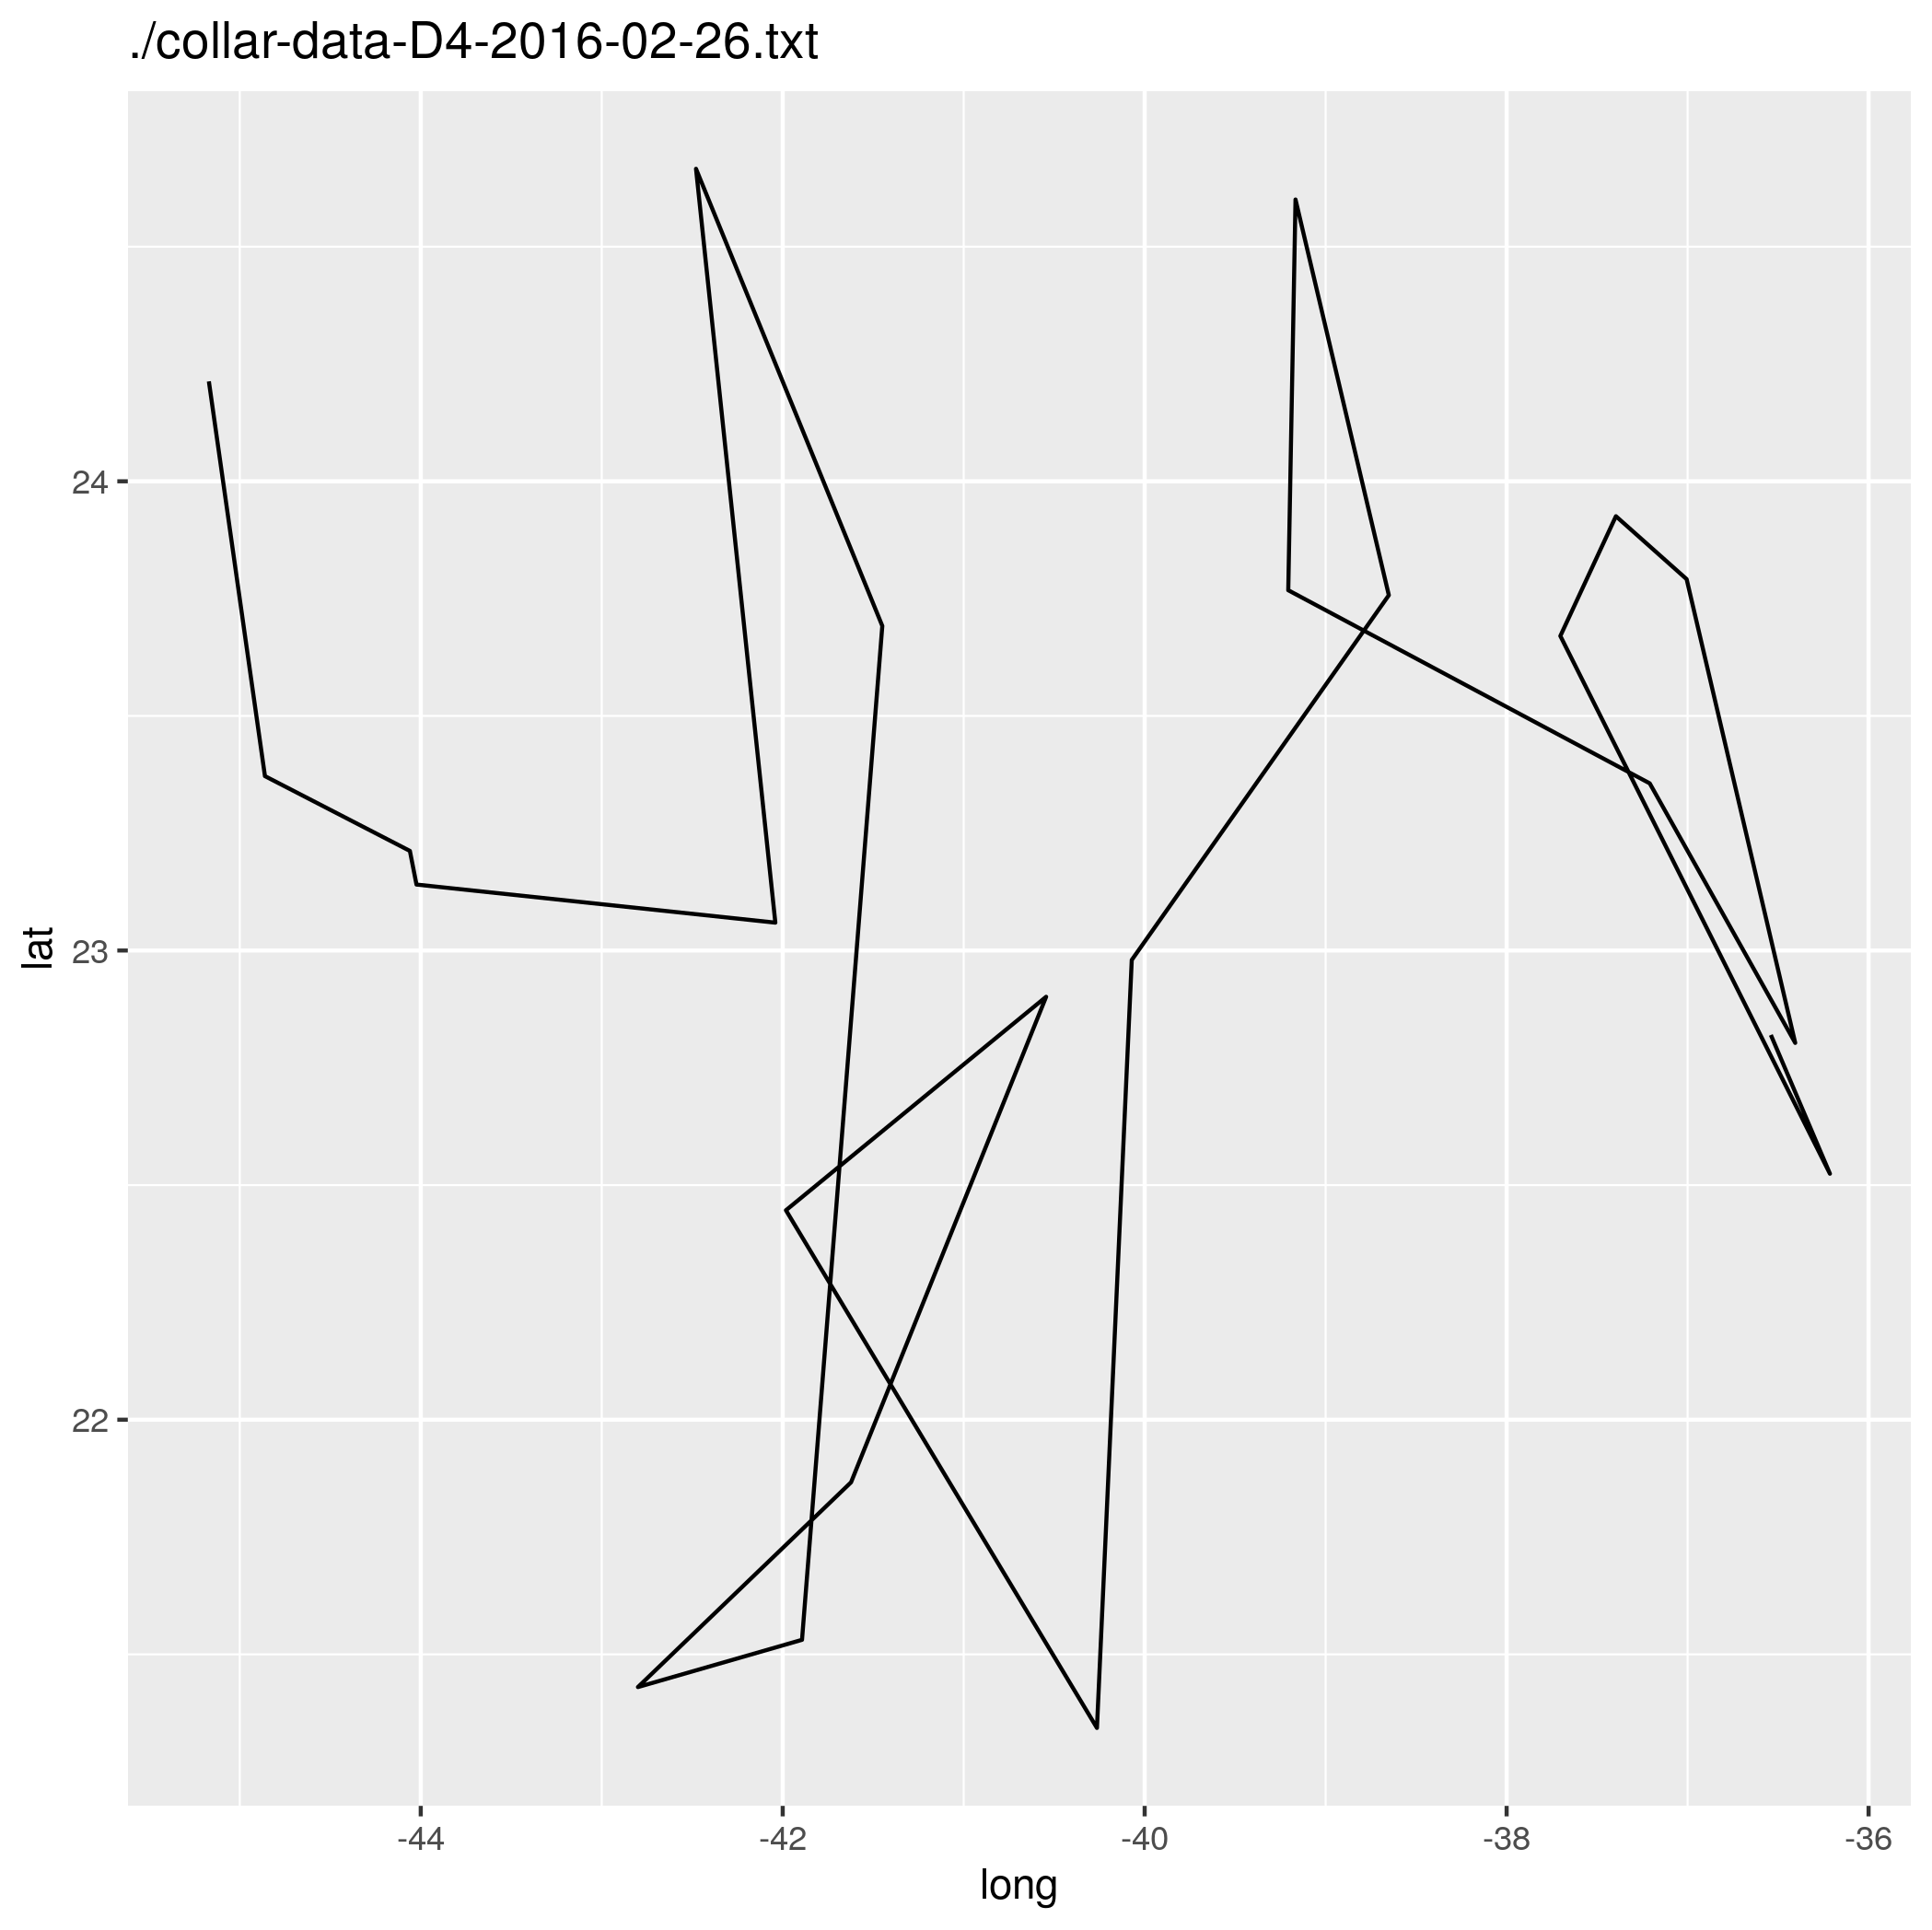
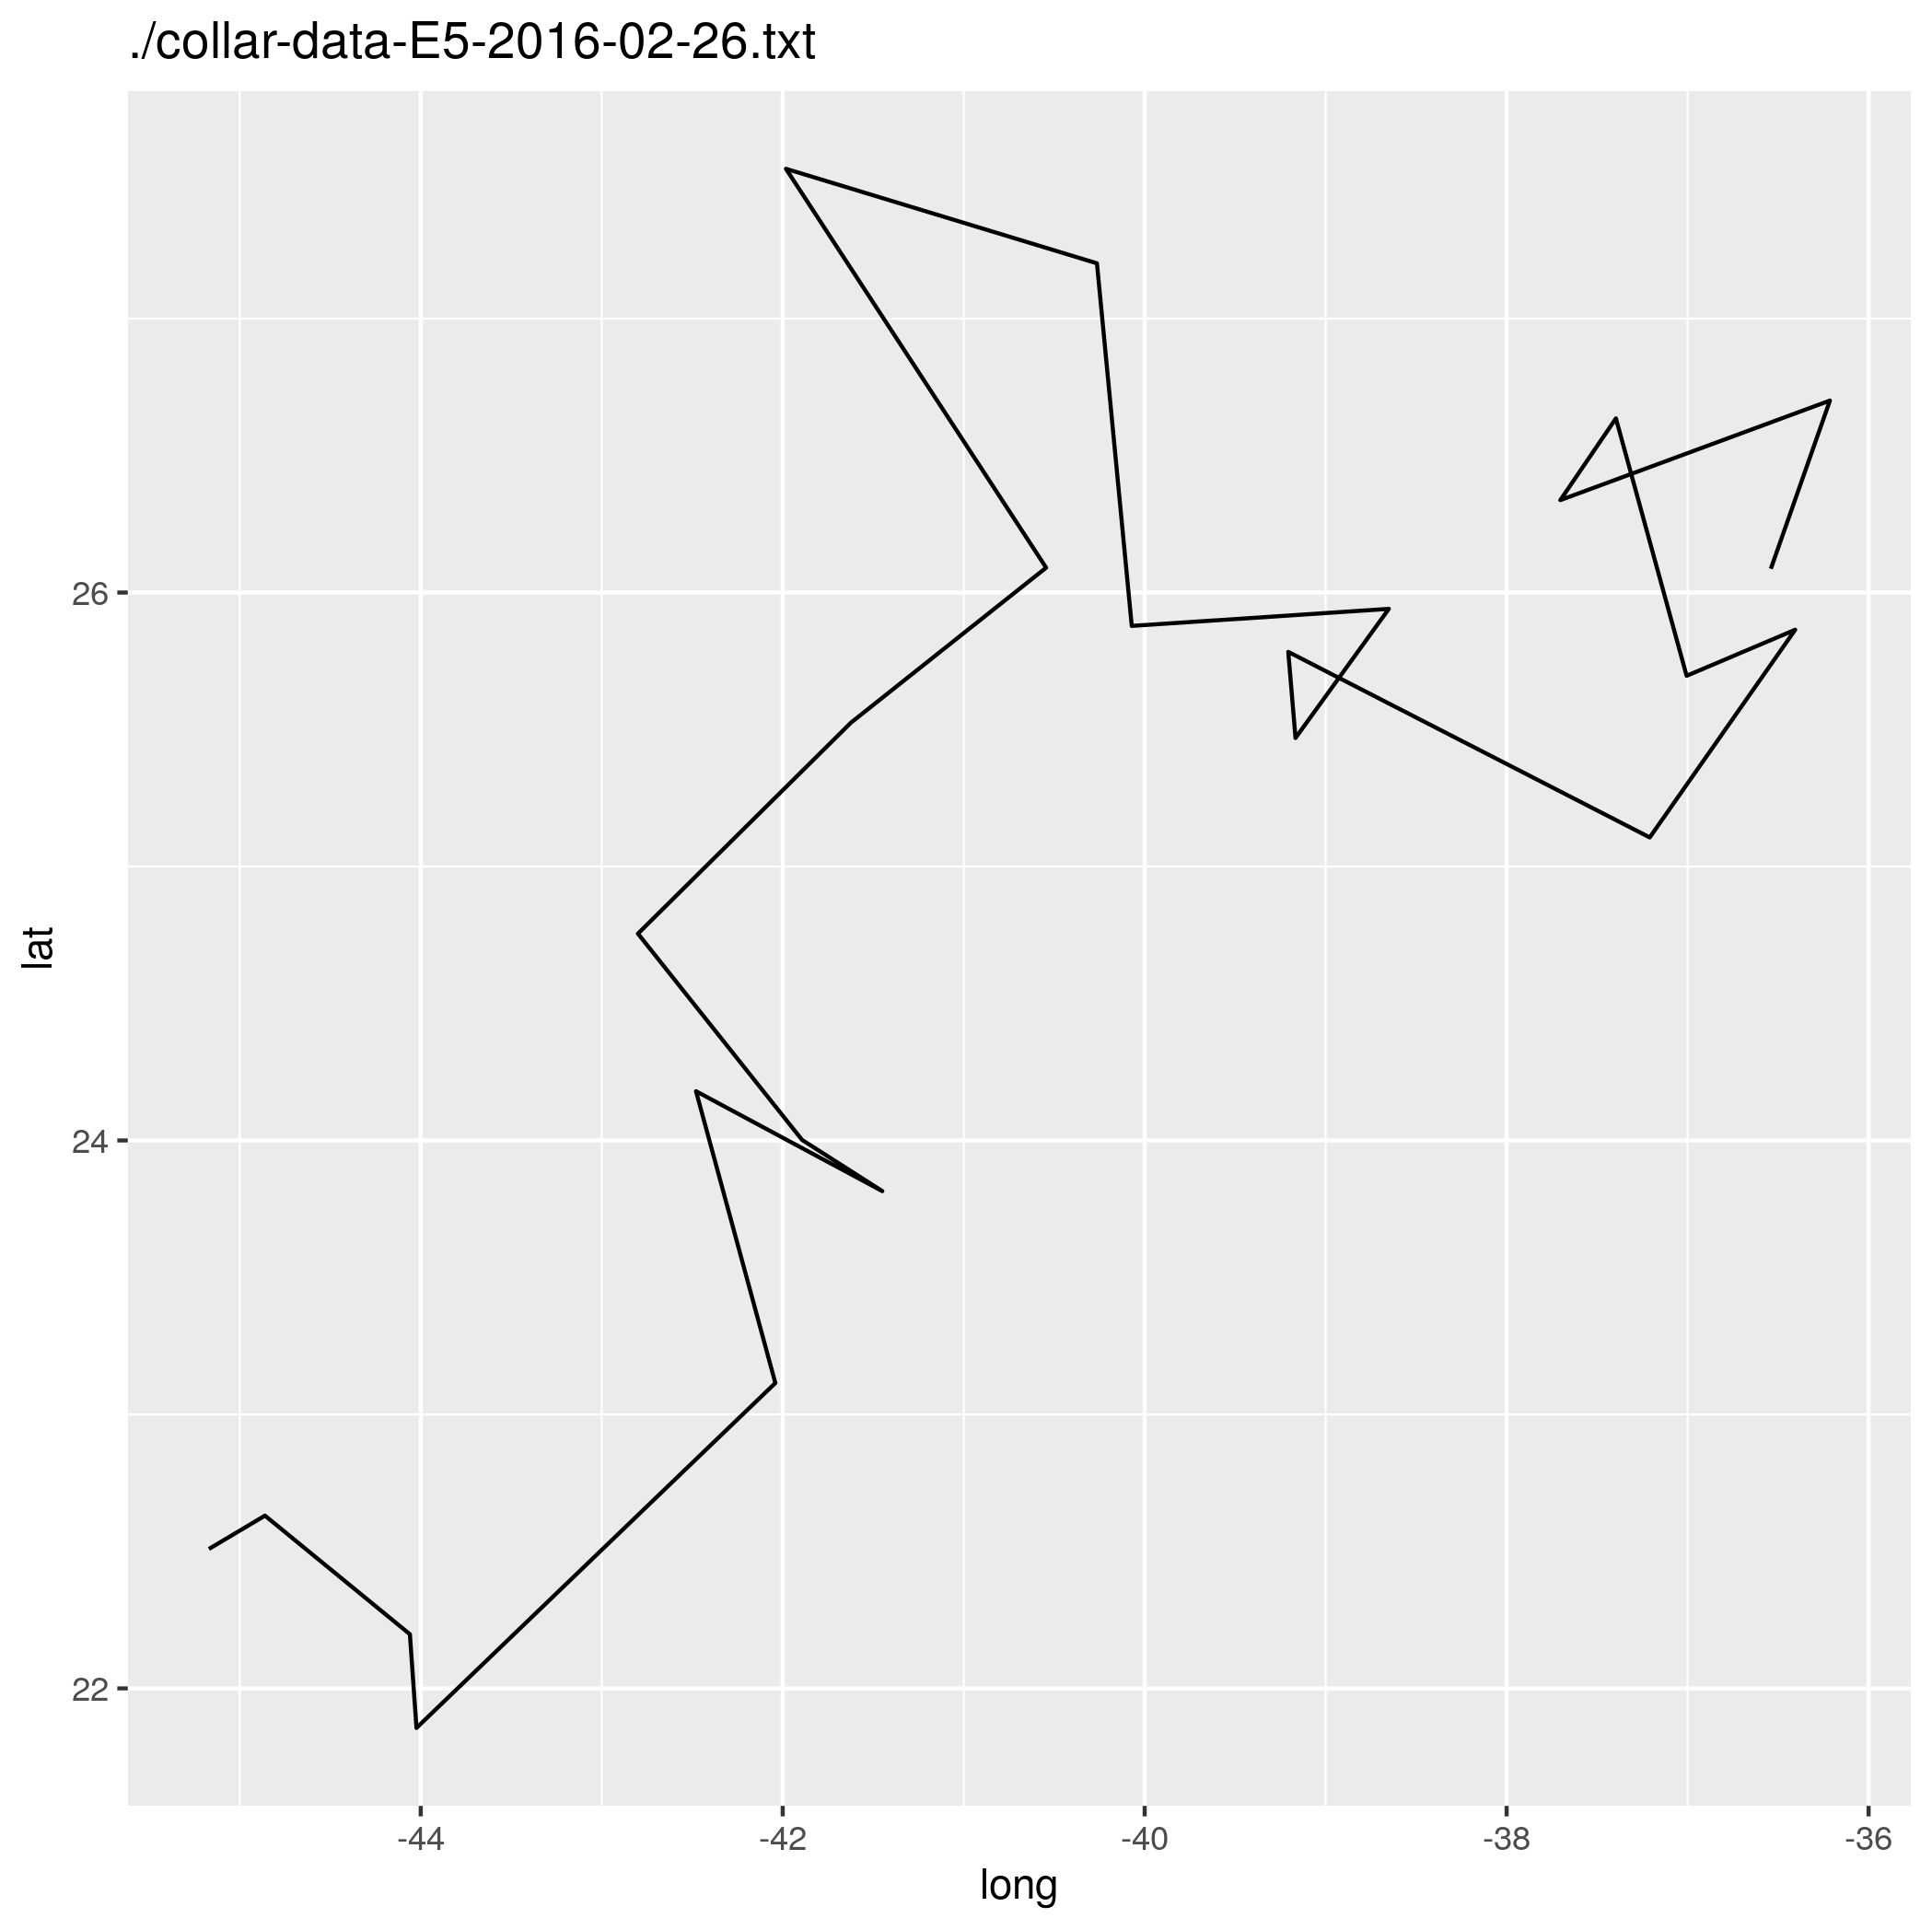
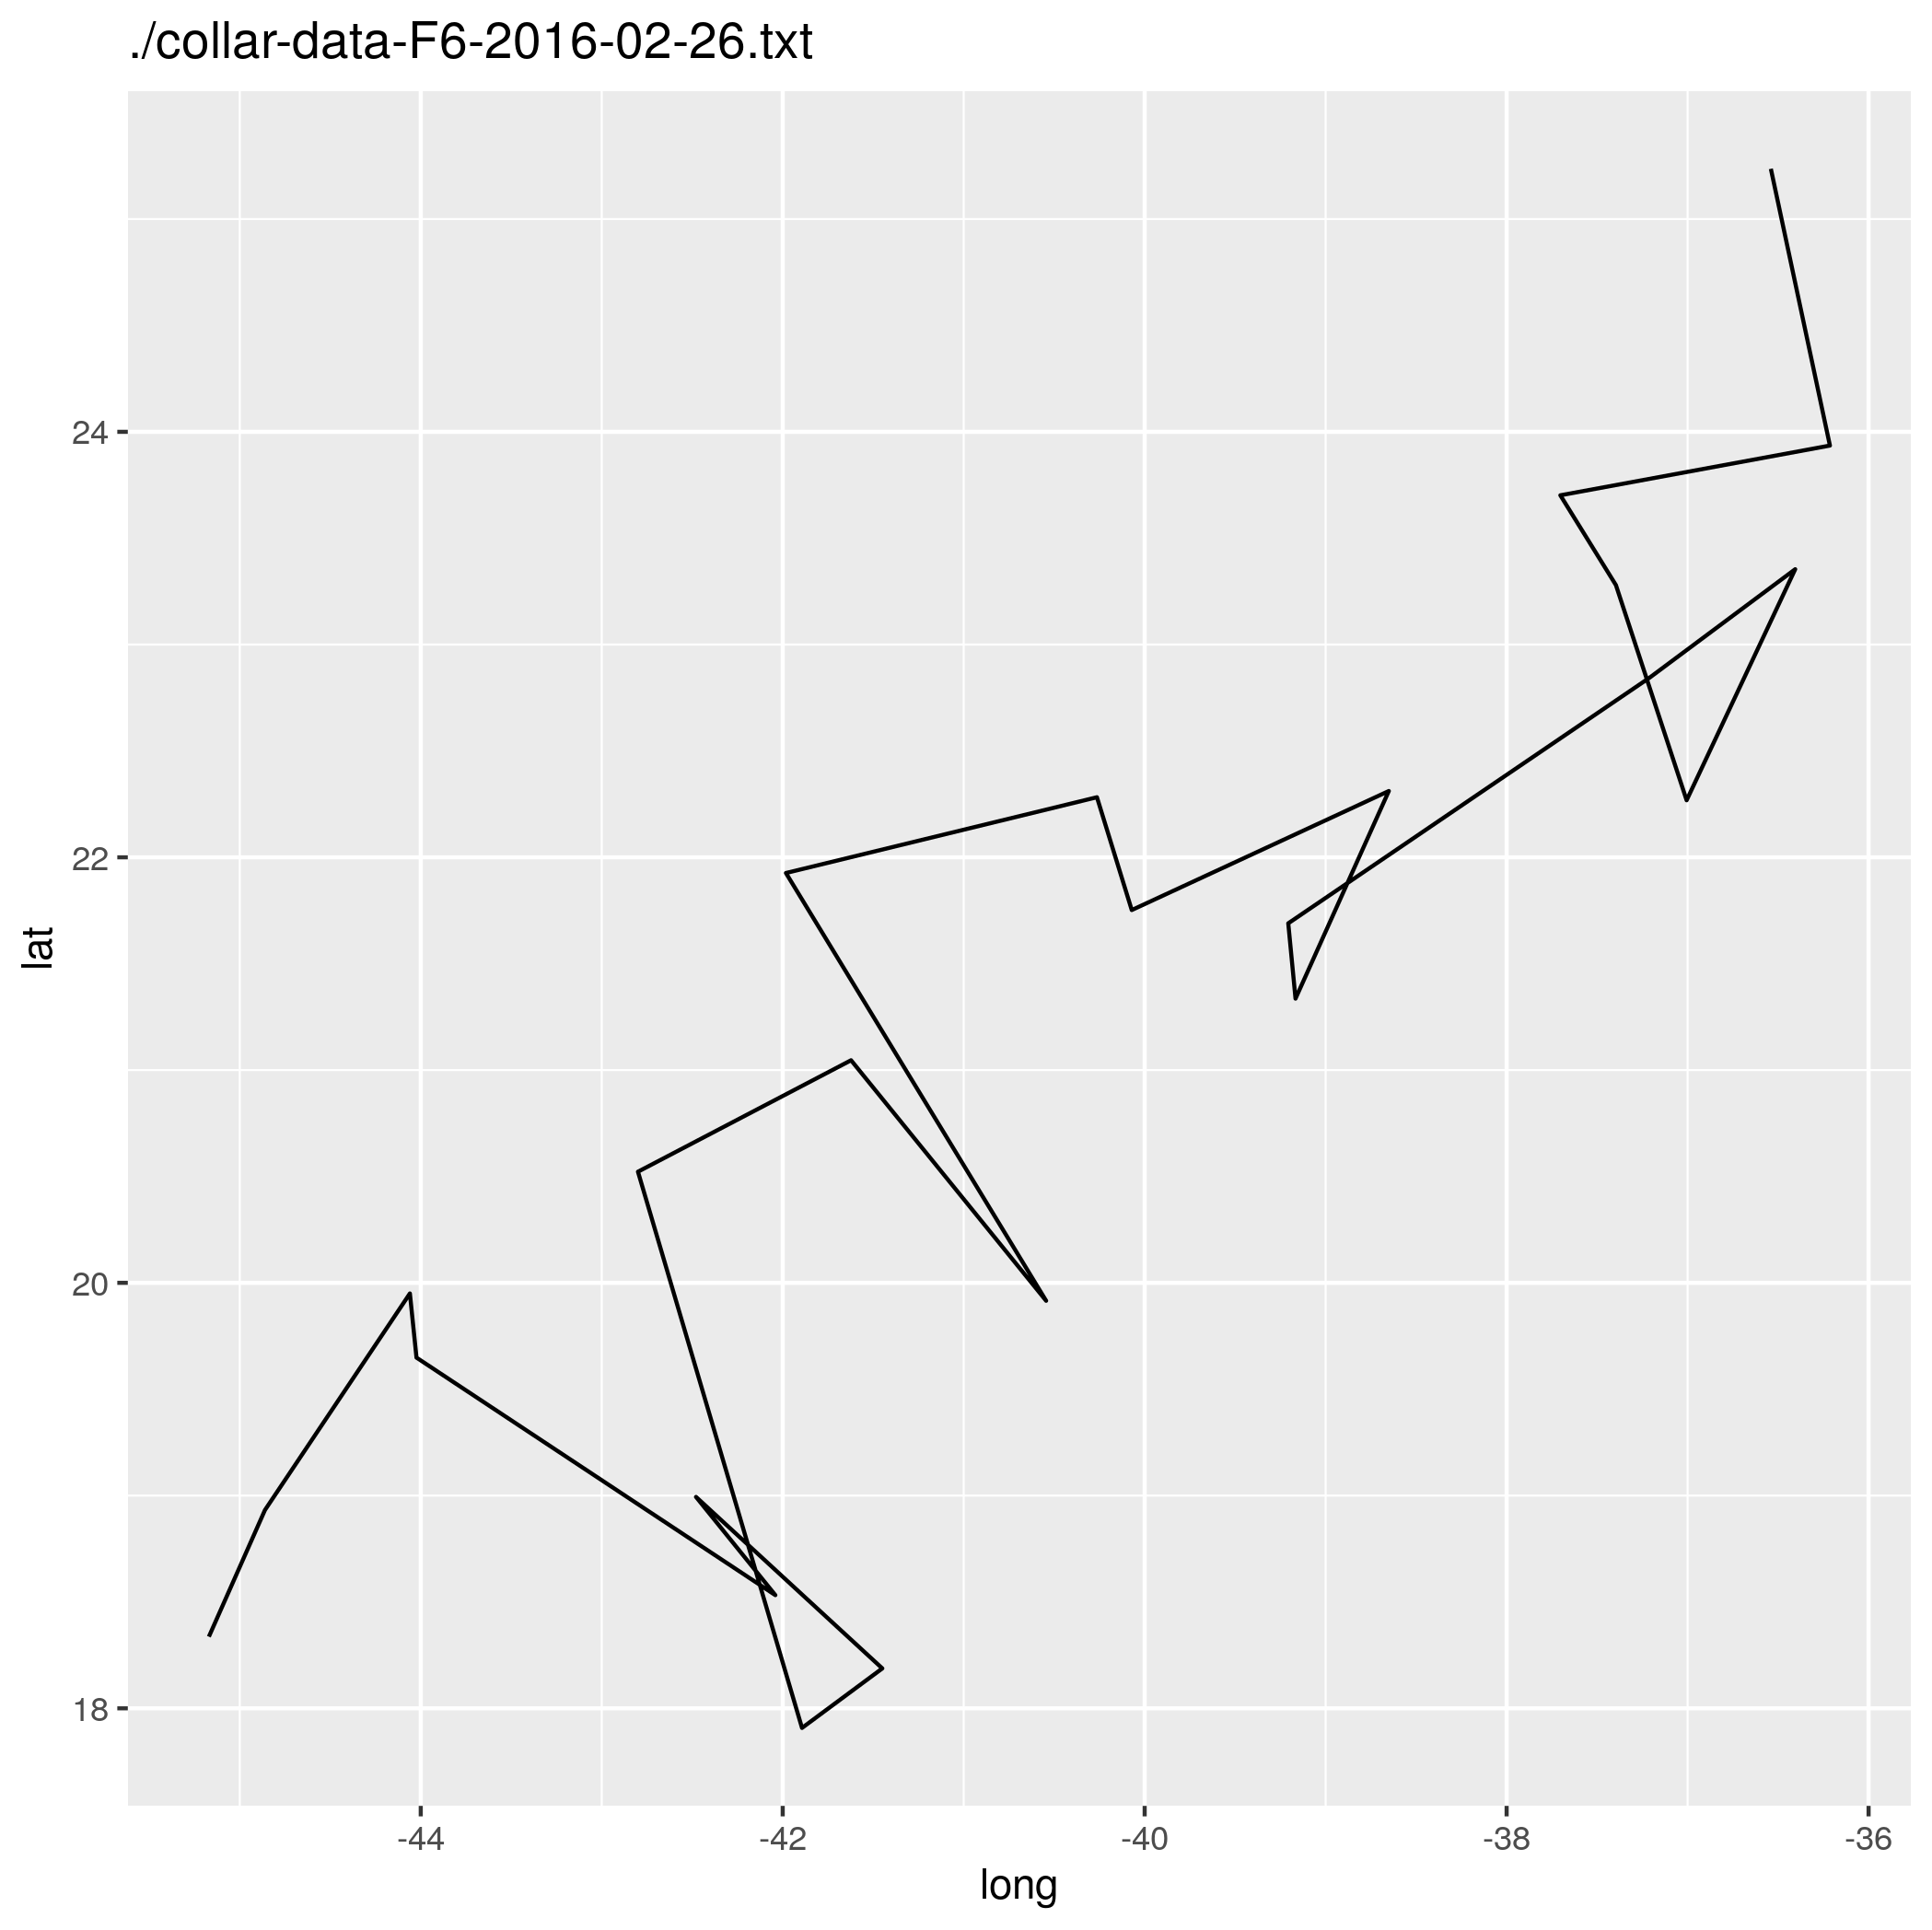
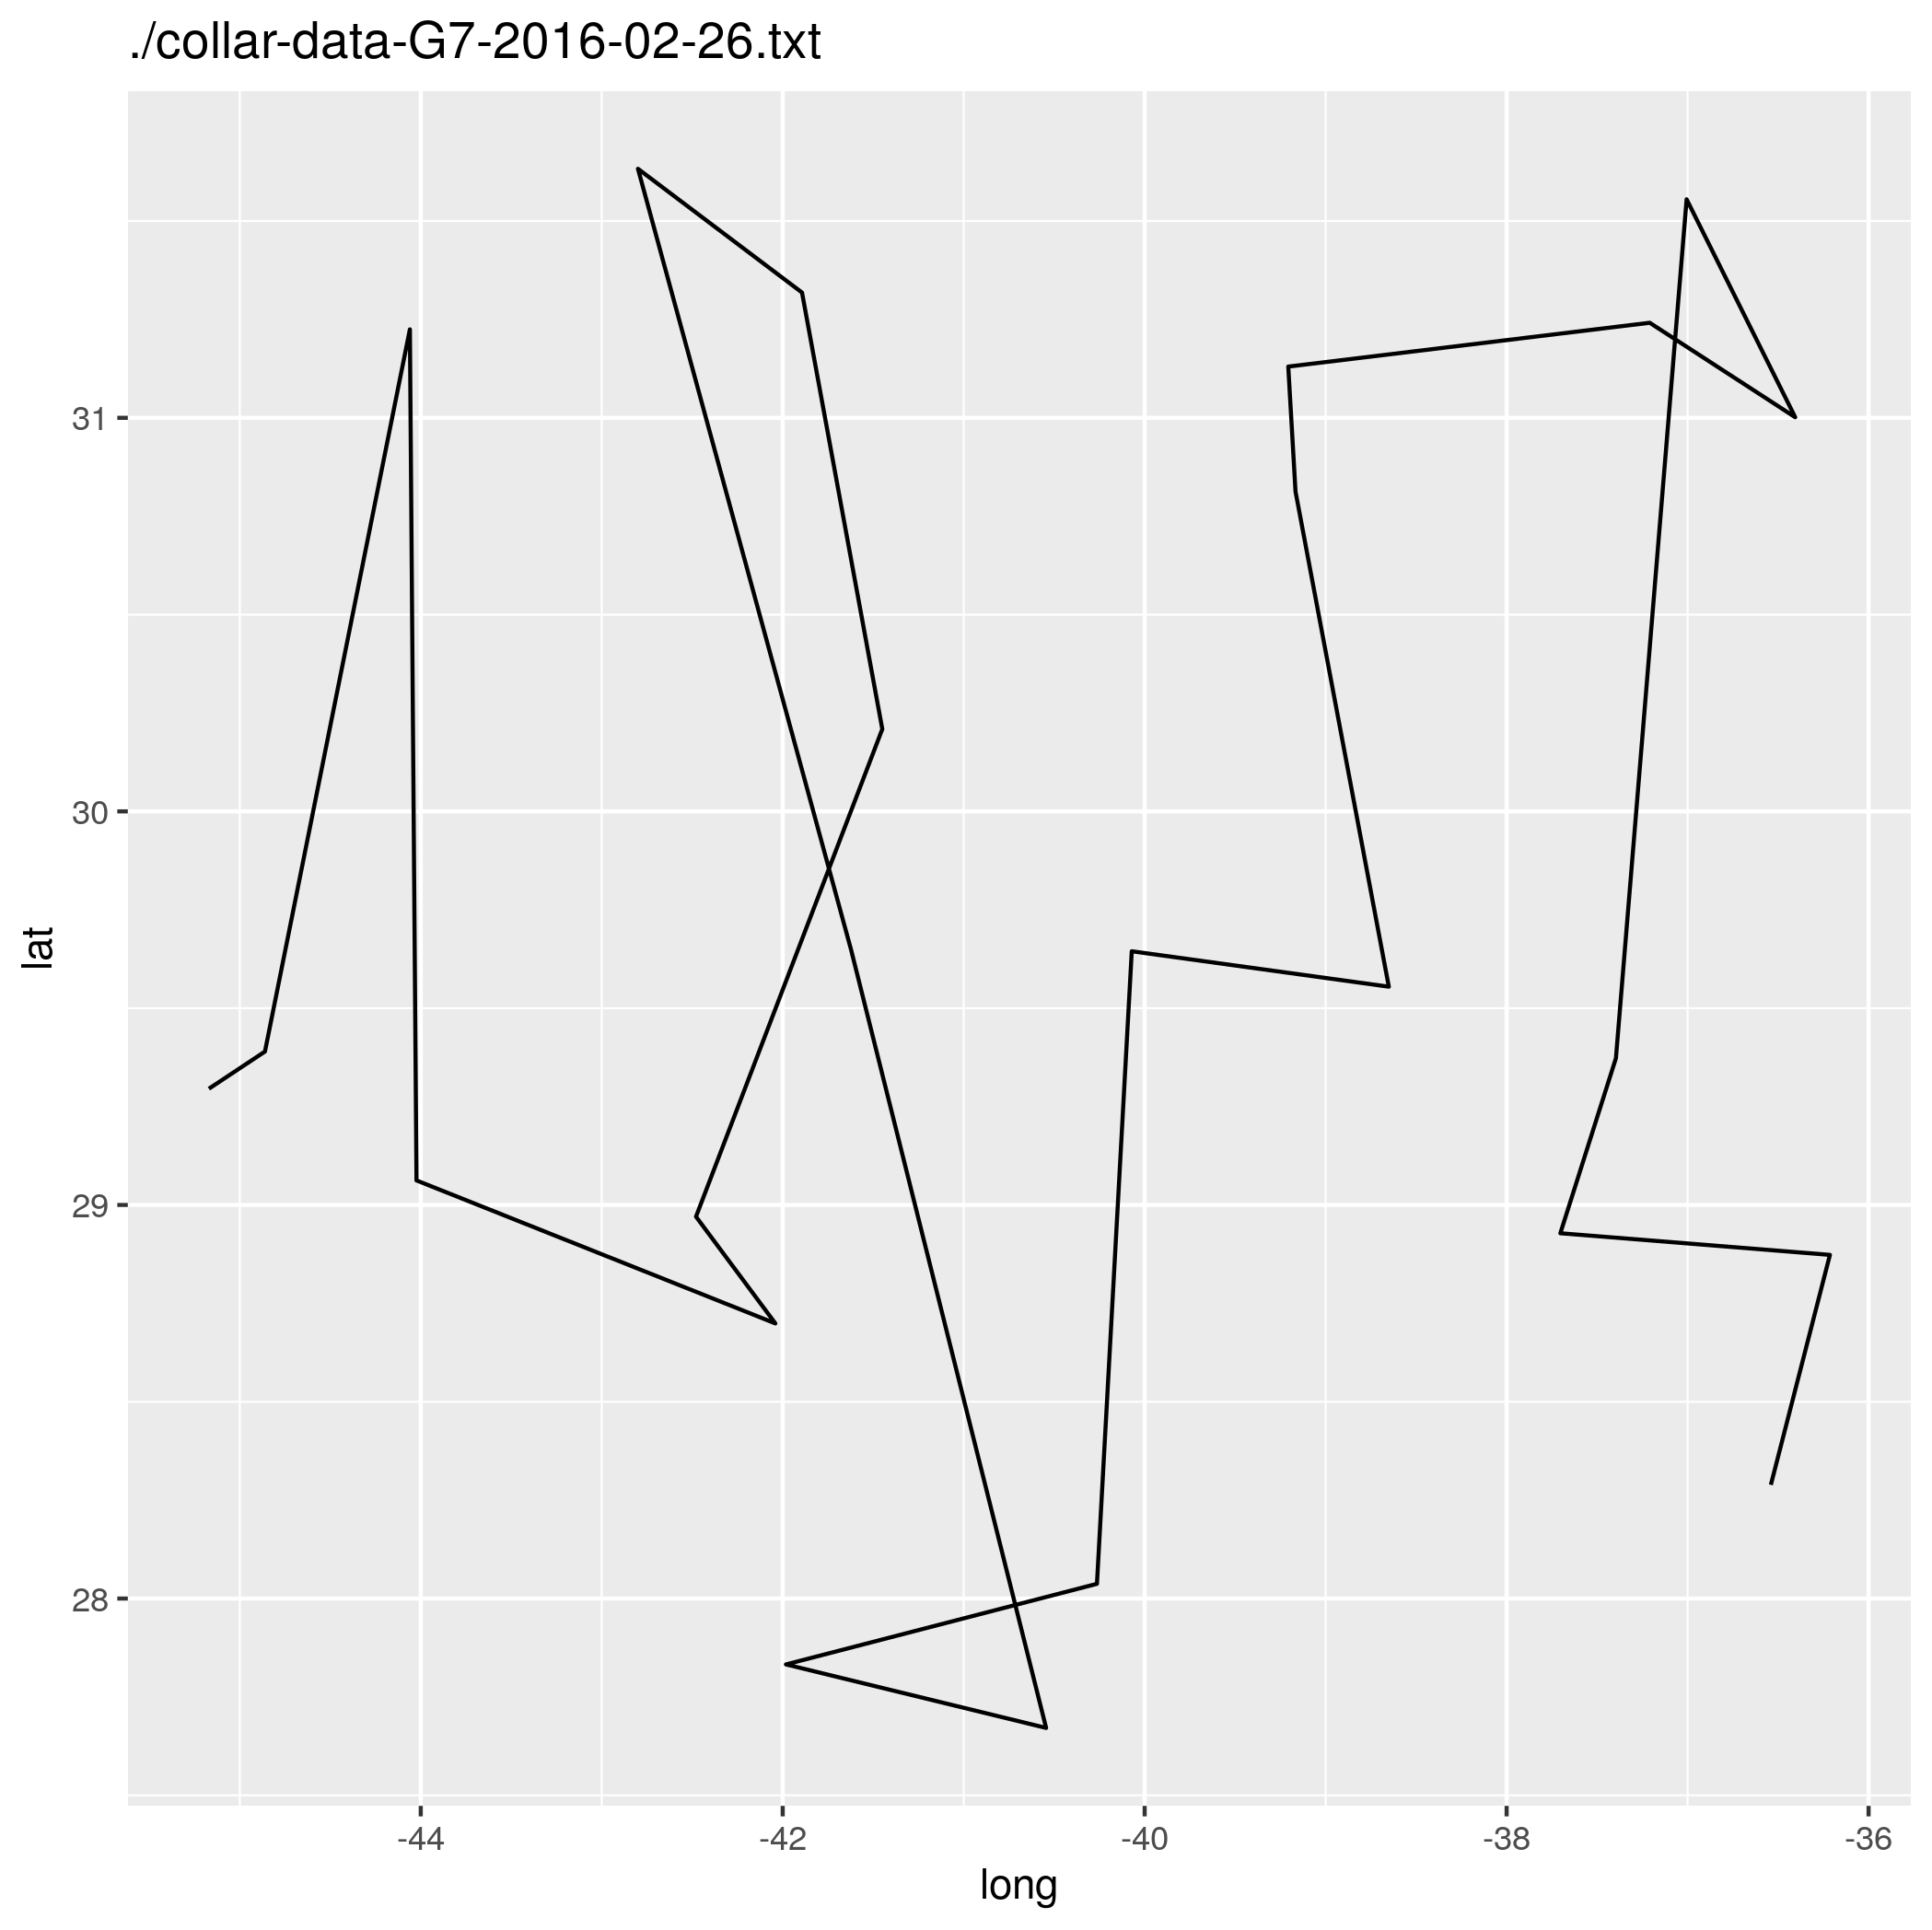
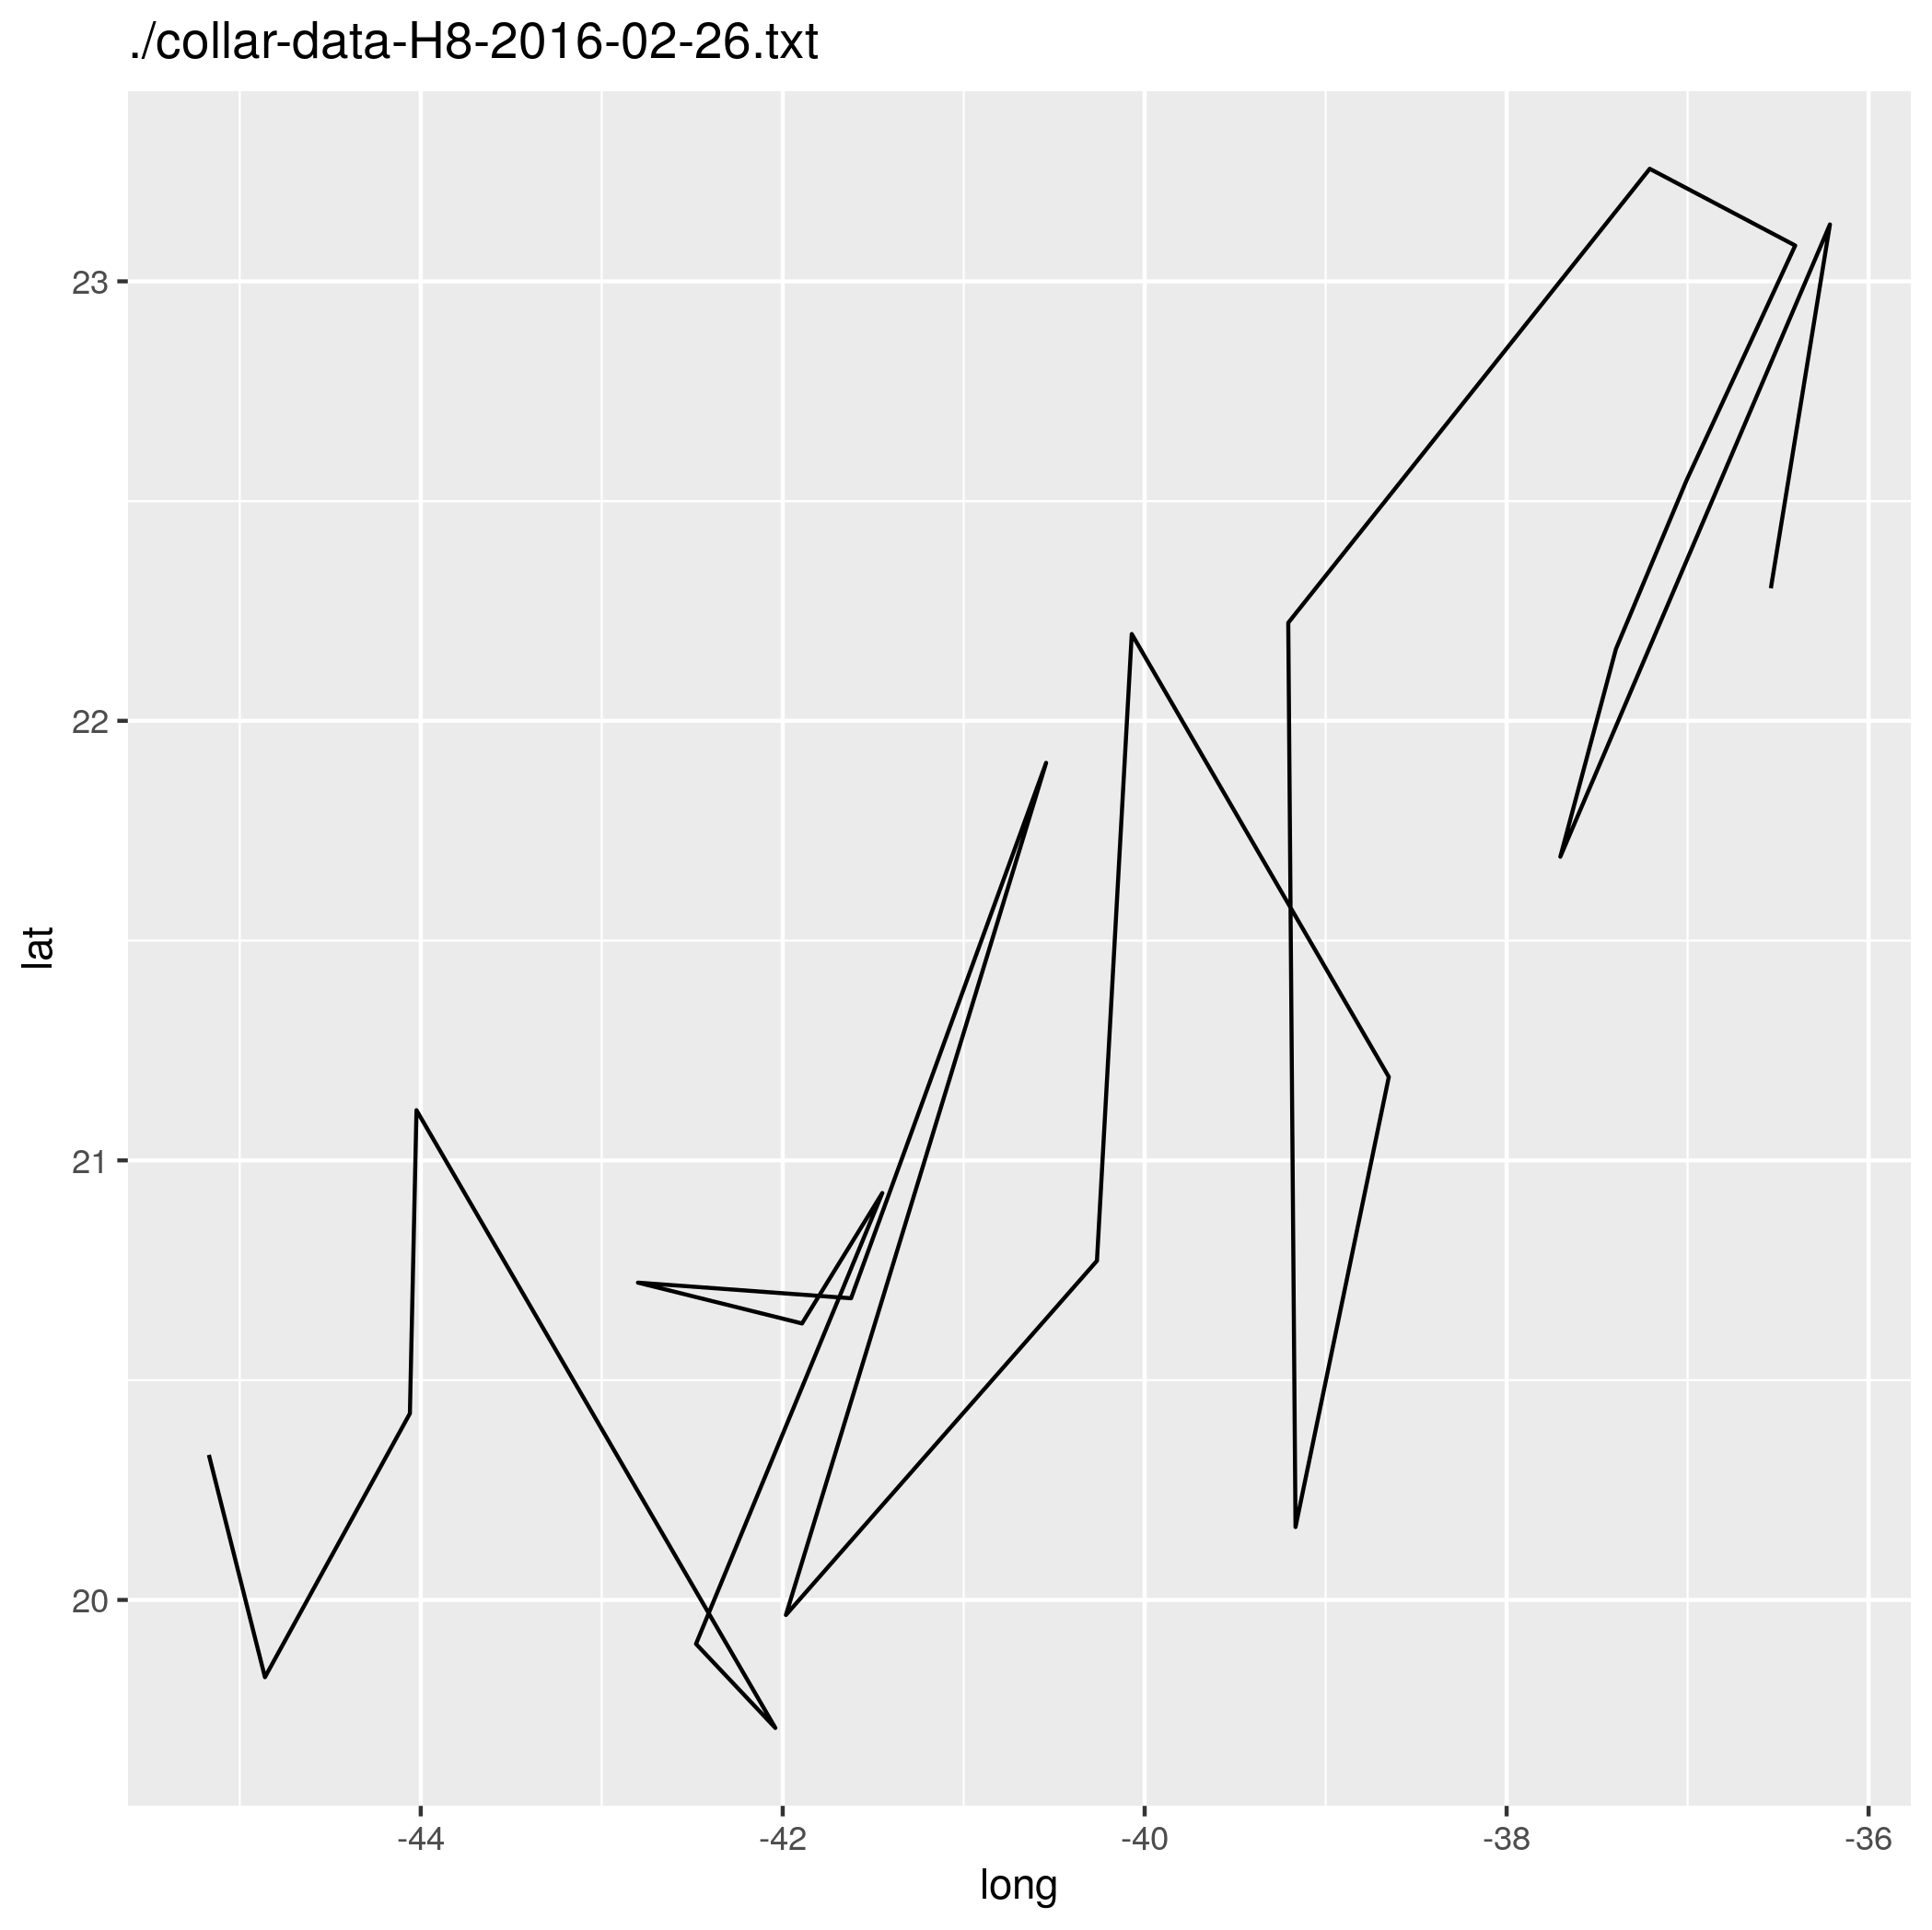
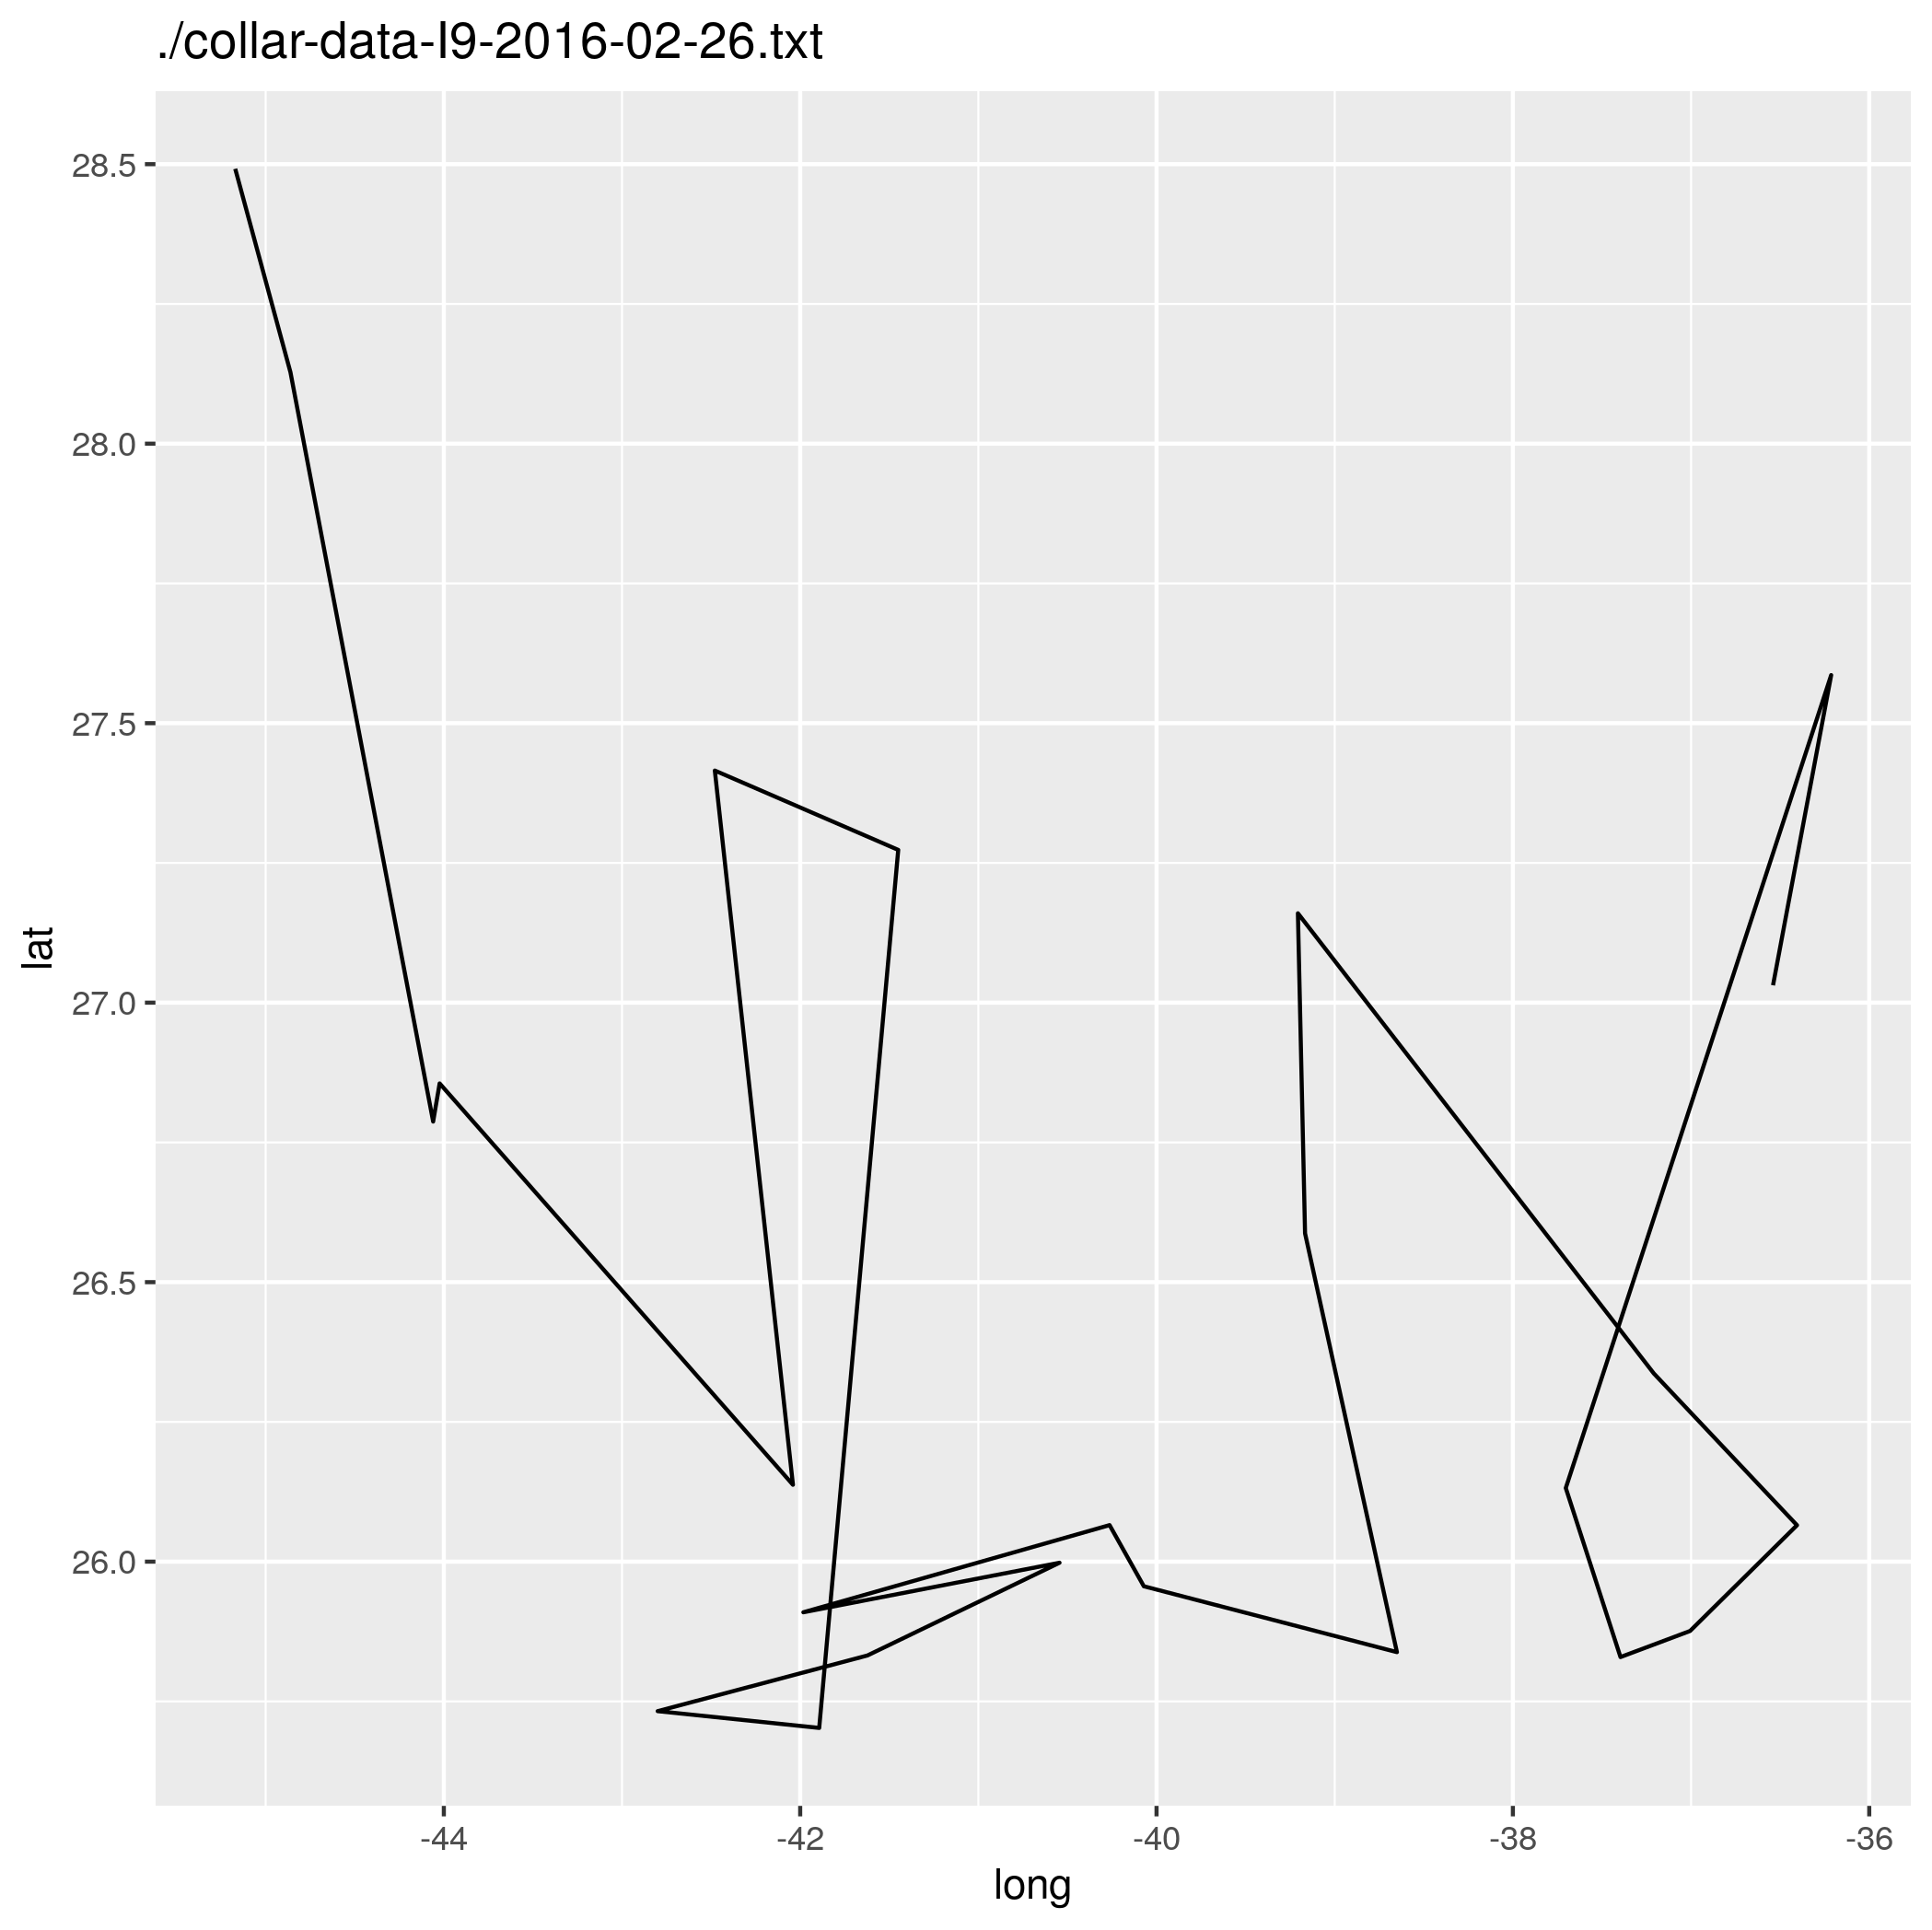
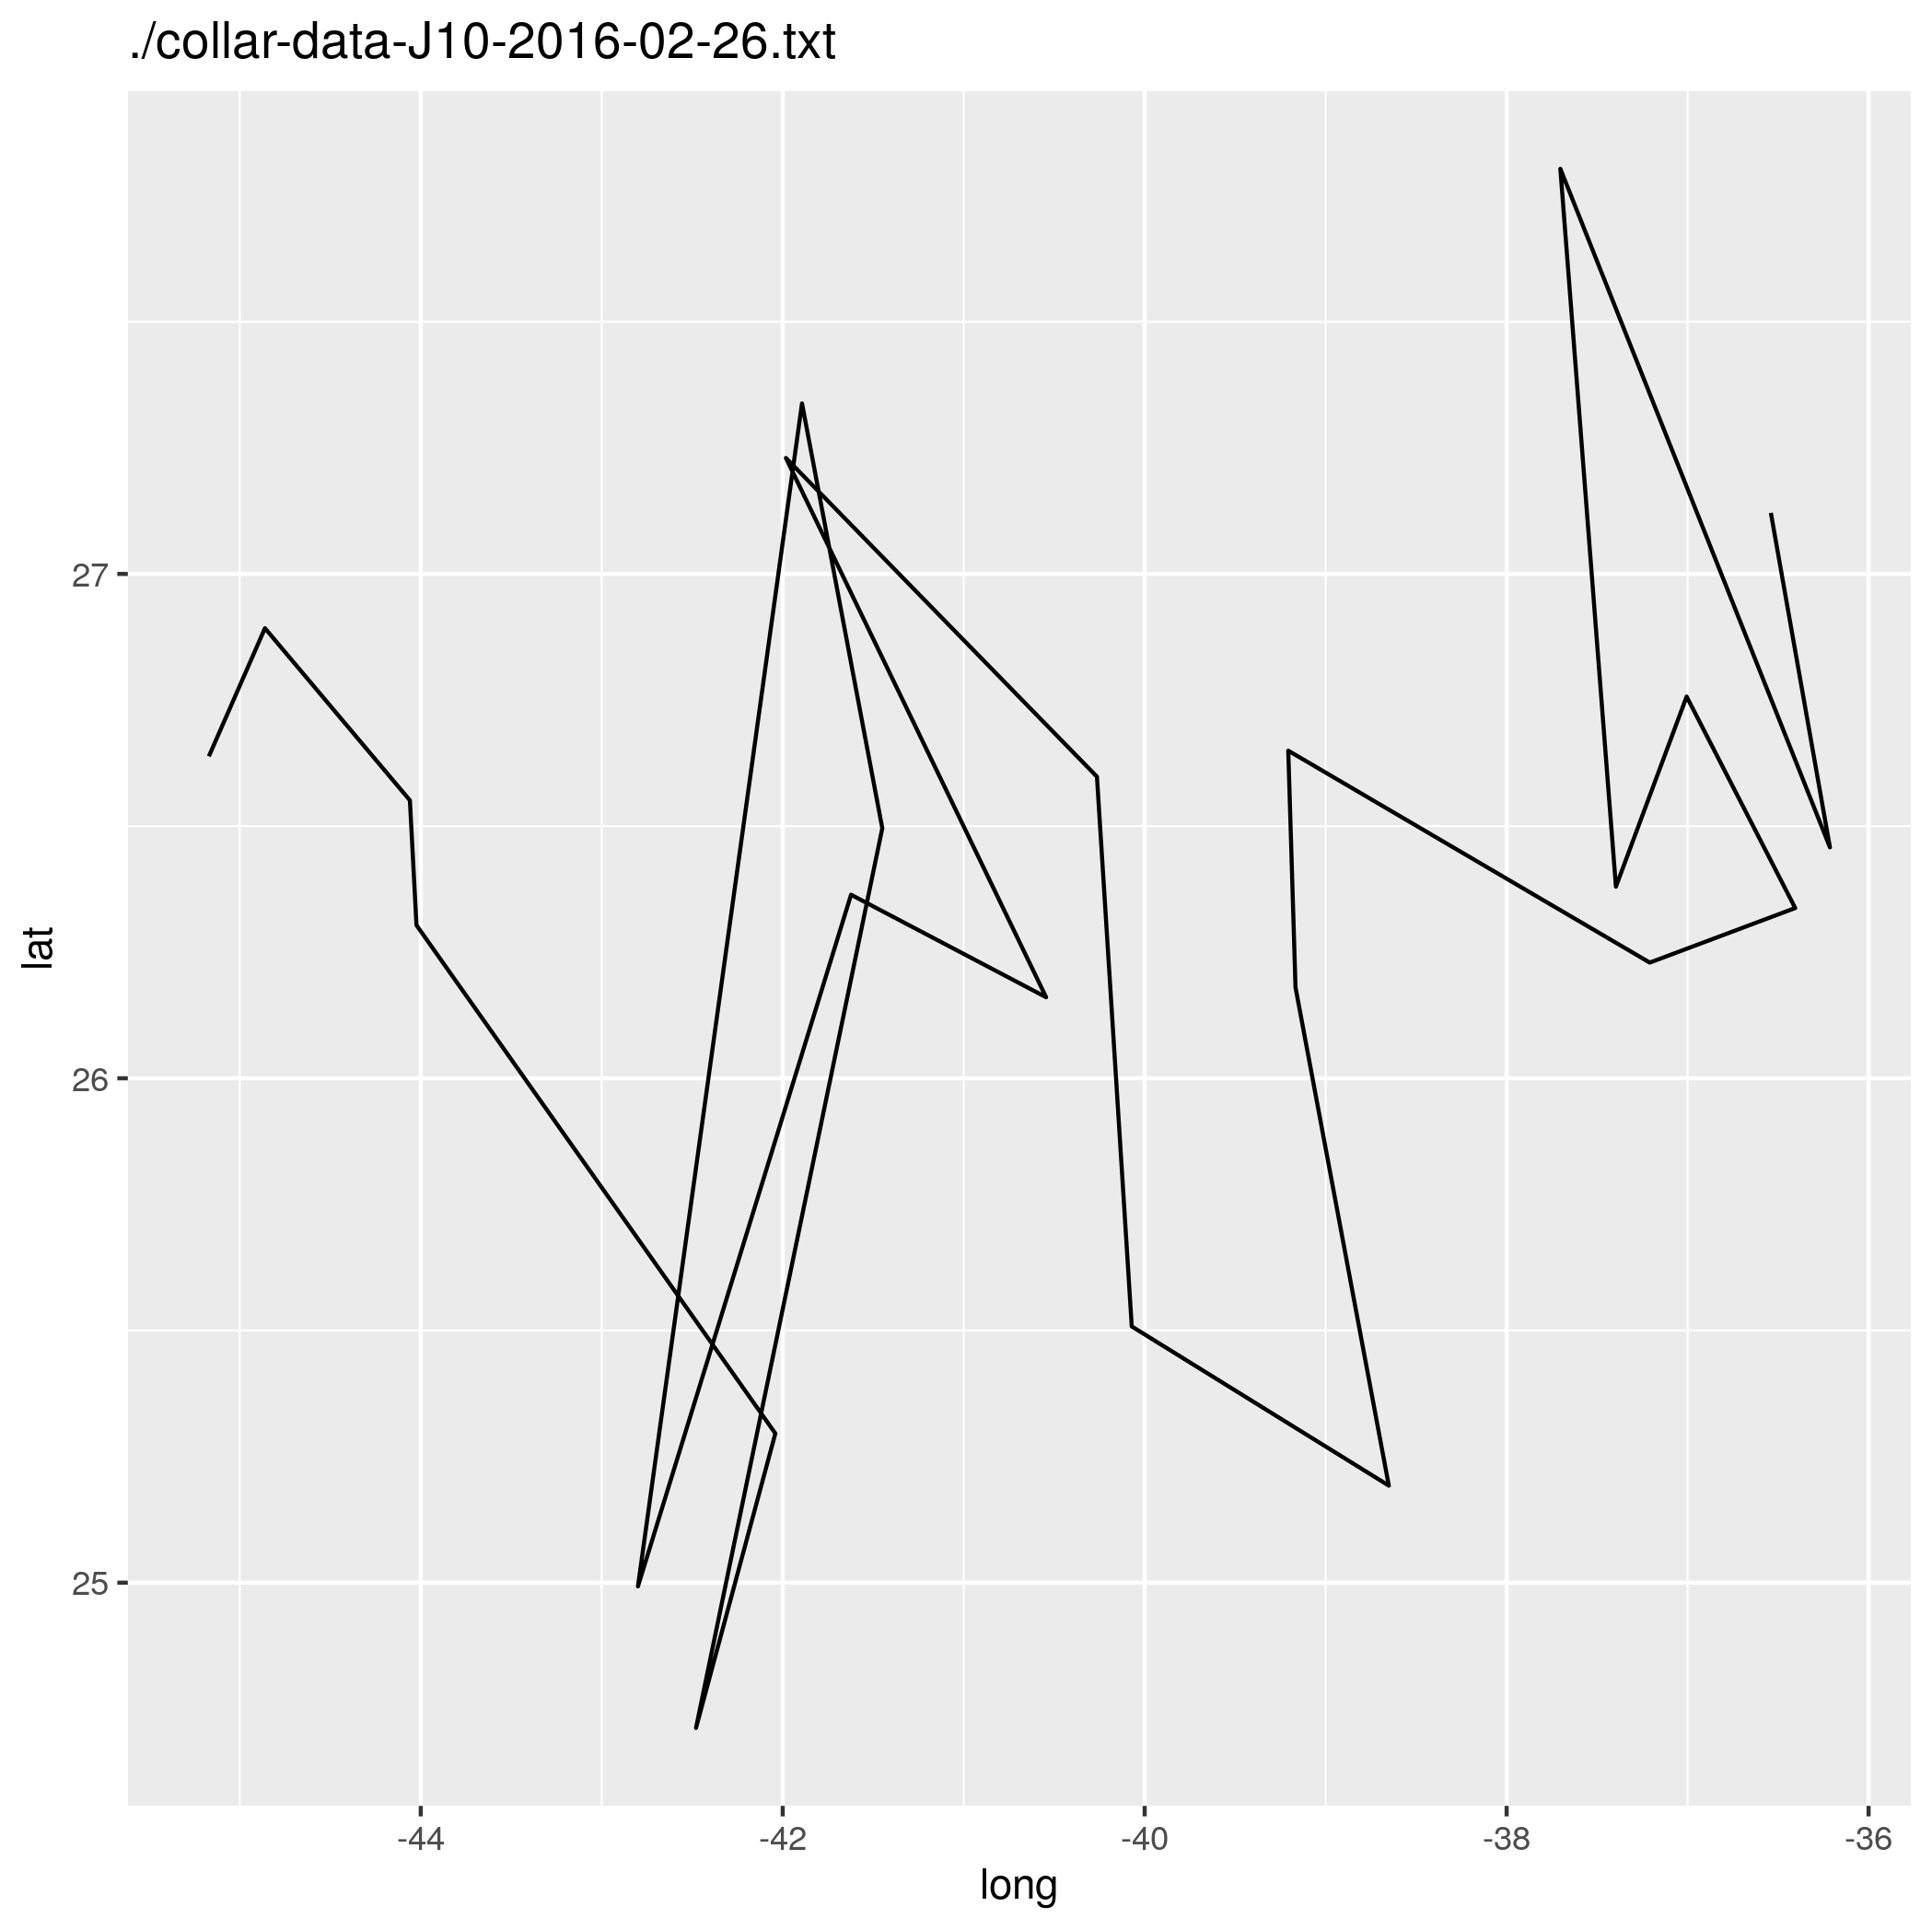
Use a loop to load each of these files into R and make a line plot (using
geom_path()) for each file withlongon thexaxis andlaton theyaxis. Graphs, like other types of output, won’t display inside a loop unless you explicitly display them, so you need put yourggplot()command inside aprint()statement. Include the name of the file in the graph as the graph title usinglabs(). -
Add code to the loop to calculate the minimum and maximum latitude in the file, and store these values, along with the name of the file, in a data frame. Show the data frame as output.
If you’re interested in seeing another application of for loops, check out the code used to simulate the data for this exercise using for loops.
Expected outputs for Multi-file Analysis: 1 2 3 4 5 6 7 8 9 10 11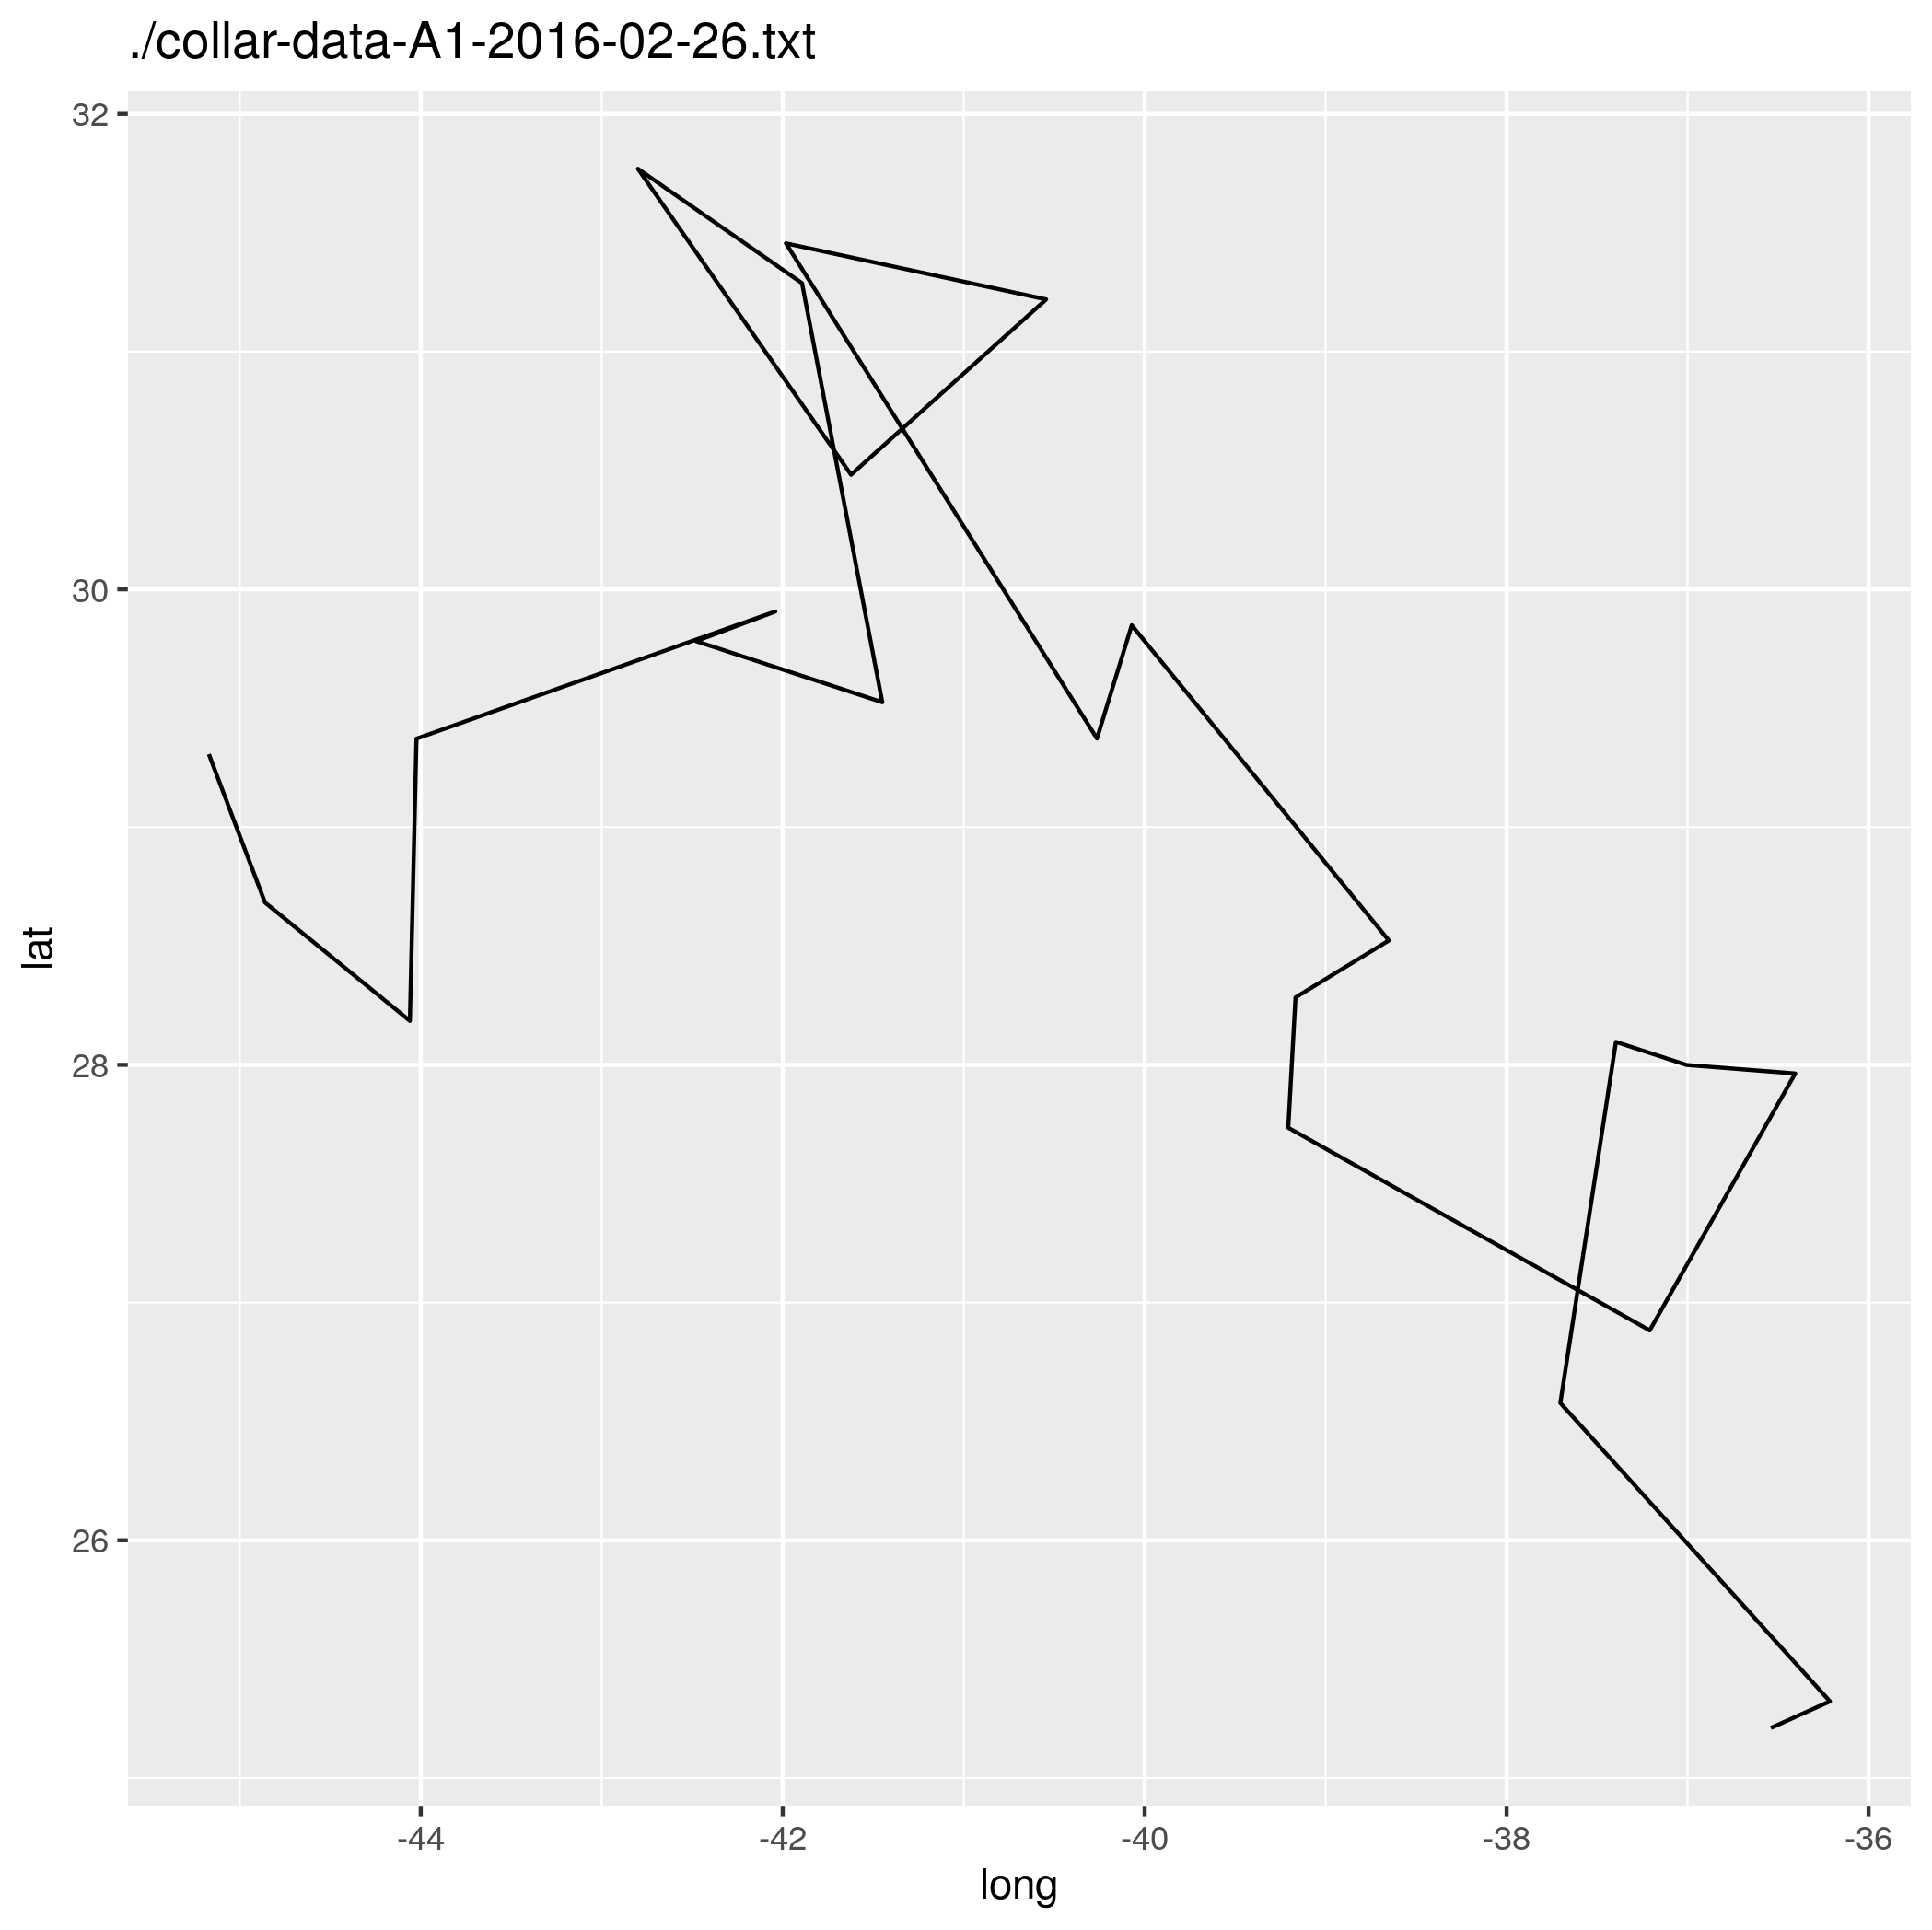