Cocili Data Exploration (Capstone)
Understanding the spatial distribution of ecological phenomena is central to the study of natural systems. A group of scientists has collected a dataset on the size, location, and species identify of all of the trees in a 4 ha site in Panama call “Cocoli”.
Download the Cocoli Data and explore the following spatial properties.
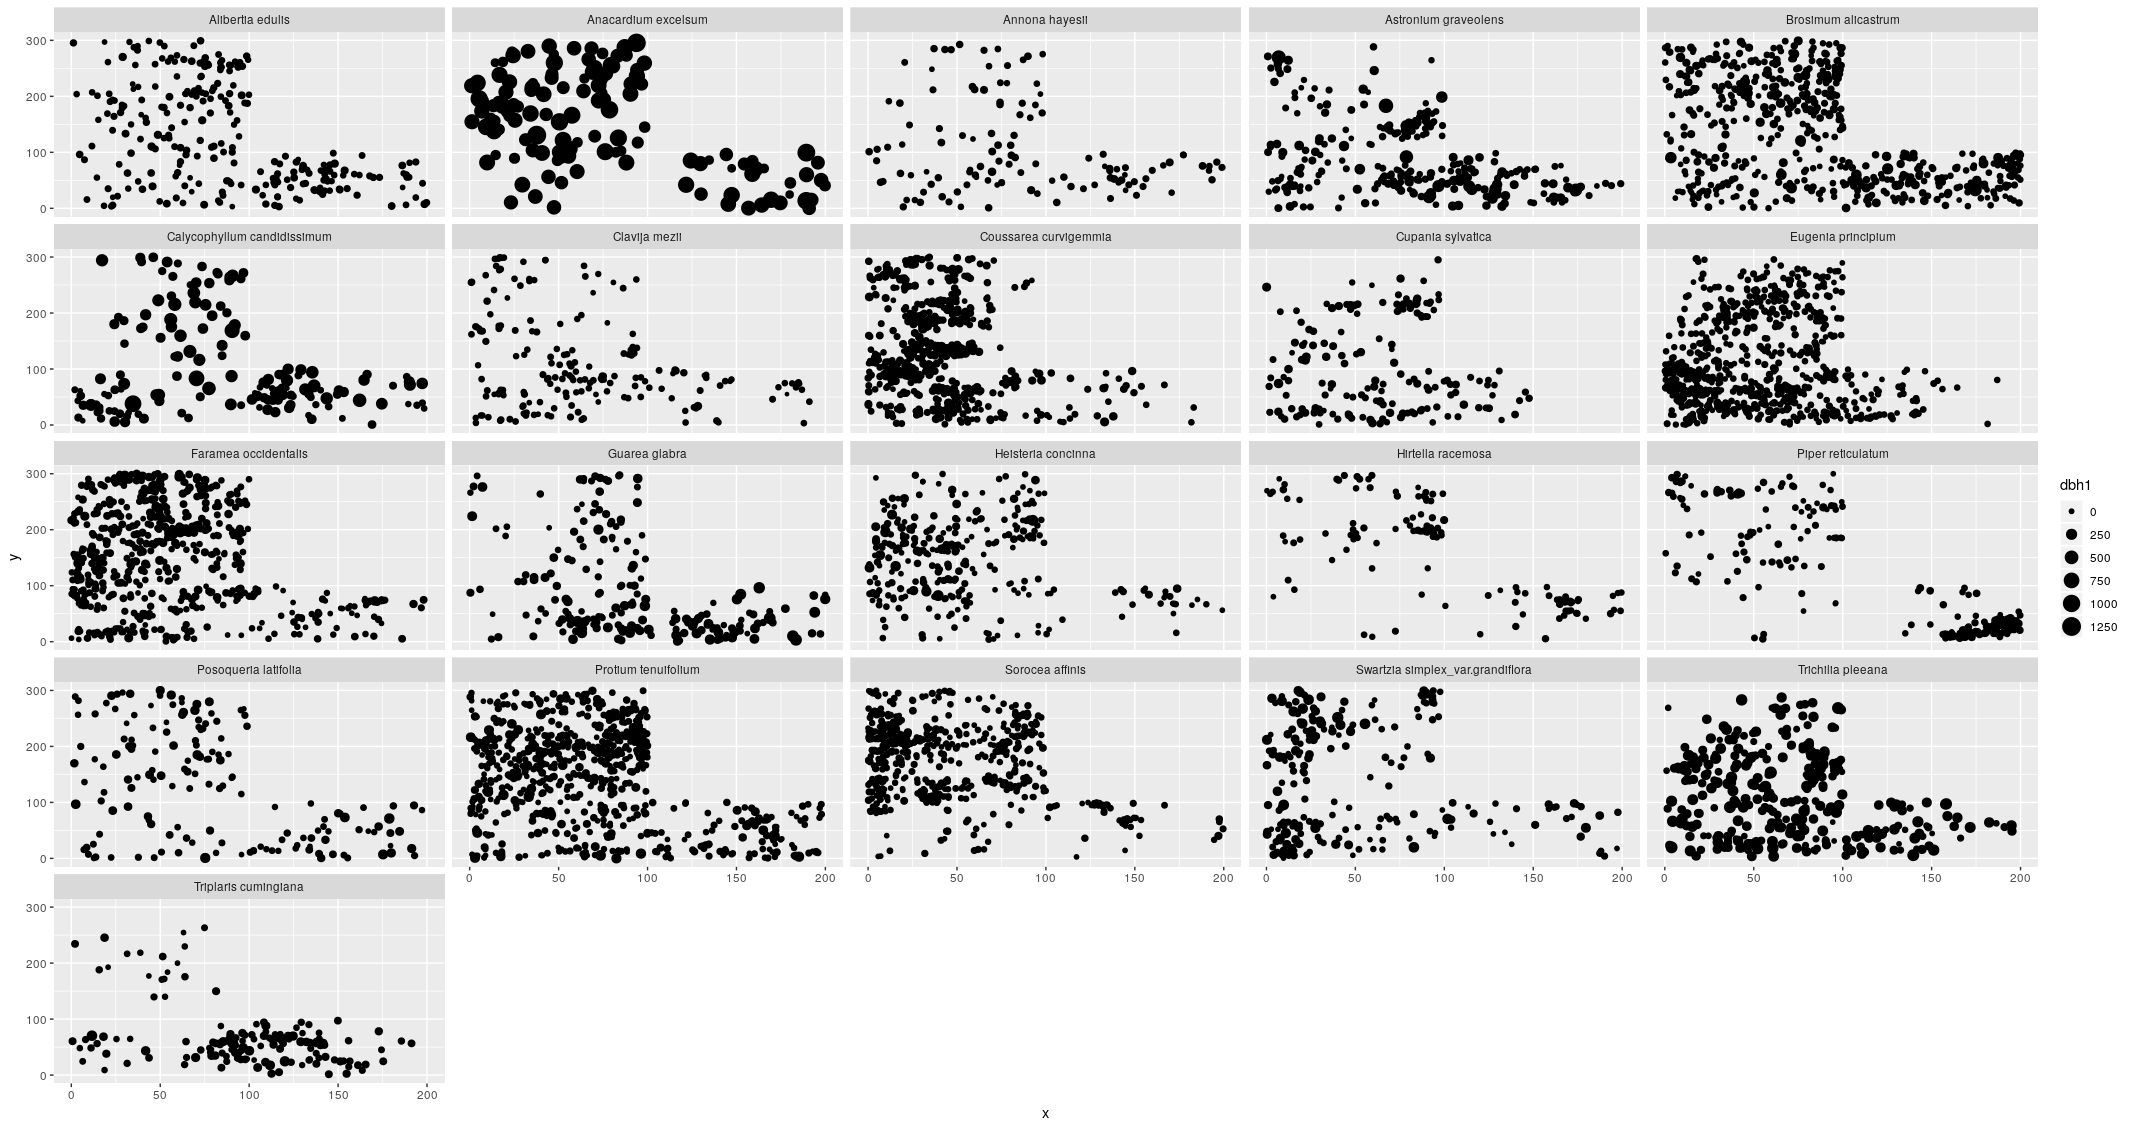
- Make a single plot showing the location of each tree for all species with
more than 100 individuals. Each species should be in its own subplot (i.e.,
facet). Label the subplots with the genus and species names, not the species
code. Scale the size of the point by its stem diameter (use
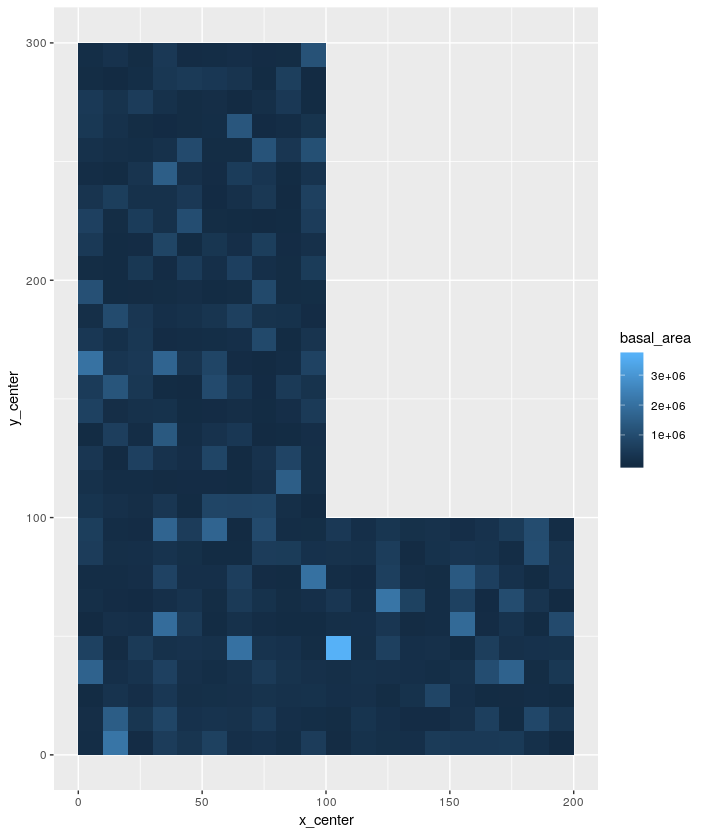
dbh1) so that larger trees display as larger points. Have the code save the plot in afiguresfolder in your project. - Basal area is a common measure in
forest management and ecology. It is the sum of the cross-sectional areas of
all of the trees occuring in some area and can be calculated as the sum of
0.00007854 * DBH^2 over all of the trees. To look at how basal area varies
across the site divide the site into 100 m^2 sample regions (10 x 10 m cells)
and determining the total basal area in each region. I.e., take all of the
trees in a grid cell where x is between 0 and 10 and y is between 0 and 10
and determine their basal area. Do the same thing for x between 0 and 10 and
y between 10 and 20, and so on. You can do this using two “nested” for loops
to subset the data and calculate the basal area in that region. Make a plot
that shows how the basal area varies spatially. Since the calculation is for
a square region, plot it that way using
geom_tile()with the center of the tile at the center of the region where basal area was calculated. Have the code save the plot in afiguresfolder in your project.