Learning Objectives
Following this assignment students should be able to:
- ensure proficiency and understanding of course learning objectives
- affirm course success by completing challenge exercises
Exercises
Vector Review
The number of birds banded at a series of sampling sites has been counted by your field crew. The data are organized in two vectors. The first vector contains the alphanumeric code for each site and the second vector contains the number of birds banded per site. Cut and paste the vectors into your assignment and then answer the following questions by printing them to the screen.
sites <- c("A1", "A2", "A3", "A4", "A5", "A6", "A7", "A8", "B1", "B2", "B3", "B4", "B5", "B6", "B7", "B8", "C1", "C2", "C3", "C4", "D1", "D2", "D3", "D4", "D5", "D6") counts <- c(28, 32, 1, 0, 10, 22, 30, 19, 145, 27, 36, 25, 9, 38, 21, 12, 122, 87, 36, 3, 0, 5, 55, 62, 98, 32)- How many sites are there?
- How many birds were counted at the 7th site?
- How many birds were counted at the last site?
- What is the total number of birds counted across all sites?
- What is the average number of birds seen on a site?
- What is the total number of birds counted on sites with codes beginning with C? Don’t just identify this sites by eye, in the real world there could be hundreds or thousands of sites.
Data Management Review
Dr. Morales is interested in studying the relationship between the length of house-elves’ ears and aspects of their DNA. This research is part of a larger project attempting to understand why house-elves possess such powerful magic. She has obtained DNA samples and ear measurements from a small group of house-elves to conduct a preliminary analysis (prior to submitting a grant application to the Ministry of Magic) and she would like you to conduct the analysis for her (she might know everything there is to know about magic, but she sure doesn’t know much about computers). She has placed the data in a file on the web for you to download.
Write an R script that:
- Imports the data
- For each row in the dataset checks to see if the ear length is
"large"(>10 cm) or"small"(<=10 cm) and determines the GC-content of the DNA sequence (i.e., the percentage of bases that are either G or C) - Stores this information in a table where the first column has the ID for the
individual, the second column contains the string
"large"or the string"small"depending on the size of the individuals ears, and the third column contains the GC content of the DNA sequence. - Exports this table to a
csv(comma separated values) file titledgrangers_analysis.csv. - Prints the average GC-contents for large-eared elves and small-eared elves to the screen.
As you start to work on more complex problems it’s important to break them down into manageable pieces. One natural way to break this list of things down is: 1) import data; 2) determine size category; 3) determine GC-content; 4) calculate the size category and GC-content for each row of data and store it; 5) export this data to
csv; 6) calculate and print the average GC-content for large and small ears.Use functions to break the code up into manageable pieces. Remember to document your code well.
There are several different specific approaches you could take to doing calculations for each row of data. One is to use
dplyrusing therowwise()function. Another is to loop over the rows in the data.frame usingfor (row in 1:nrow(data)){...}A third is to break the
data.frameinto vectors and usesapply().Ask your instructor if you have questions about the best choices.
Expected outputs for Data Management Review: 1 2Unit Conversion Challenge
Measures of the amount of energy used by biological processes are critical to understanding many aspects of biology from cellular physiology to ecosystem ecology. There are many different units for energy use and their utilization varies across methods, research areas, and lab groups. Write a function,
convert_energy_units(energy_value, input_unit, output_unit)to convert units between the following energy values - Joules(J), Kilojoules(KJ), Calories(CAL), and Kilocalories (KCAL; this is unit used for labeling the amount of energy contained in food). A Kilojoule is 1000 Joules, a Calorie is 4.1868 Joules, a Kilocalorie is 4186.8 Joules. An example of a call to this function would look like:energy_in_cal <- 200 energy_in_j <- convert_energy_units(energy_in_cal, "CAL", "J")Make this function more efficient by linking
if elsestatements. If either the input unit or the output unit do not match the five types given above, have the function print - “Sorry, I don’t know how to convert “ + the name of the unit provided. Instead of writing an individual conversion between each of the different currencies (which would require 12 if statements) you could choose to convert all of the input units to a common scale and then convert from that common scale to the output units. This approach is especially useful since we might need to add new units later and this will be much easier using this approach.Use your function to answer the following questions:
- What is the daily metabolic energy used by a human (~2500 KCALs) in Joules.
- How many times more energy does a common seal use than a human? The common seal uses ~52,500 KJ/day (Nagy et al. 1999). Use the daily human metabolic cost given above.
- How many ergs (ERG) are there in one kilocalorie. Since we didn’t include the erg conversion this should trigger our ‘don’t know how to convert’ message
Tree Biomass Challenge
Understanding the total amount of biomass (the total mass of all individuals) in forests is important for understanding the global carbon budget and how the earth will respond to increases in carbon dioxide emissions.
We don’t normally measure the mass of a tree, but take a measurement of the diameter or circumference of the trunk and then estimate mass using equations like M = 0.124 * D2.53.
1. Estimate tree biomass for each species in a 96 hectare area of the Western Ghats in India using the following steps.
- If the file
ramesh2010-macroplots.csvisn’t already in your workspace then download a copy. - Load the data into R.
- Write a function that takes a vector of tree diameters as an argument and returns a vector of tree masses.
- Create a
dplyrpipeline that- Adds a new column (using
mutateand your function) that contains masses calculated from the diameters - Groups the data frame into species using the
SpCodecolumn - And then calculates biomass (i.e., the
sumof the masses) for each species (usingsummarize) - Stores the result as a data frame
- Adds a new column (using
- Display the resulting data frame
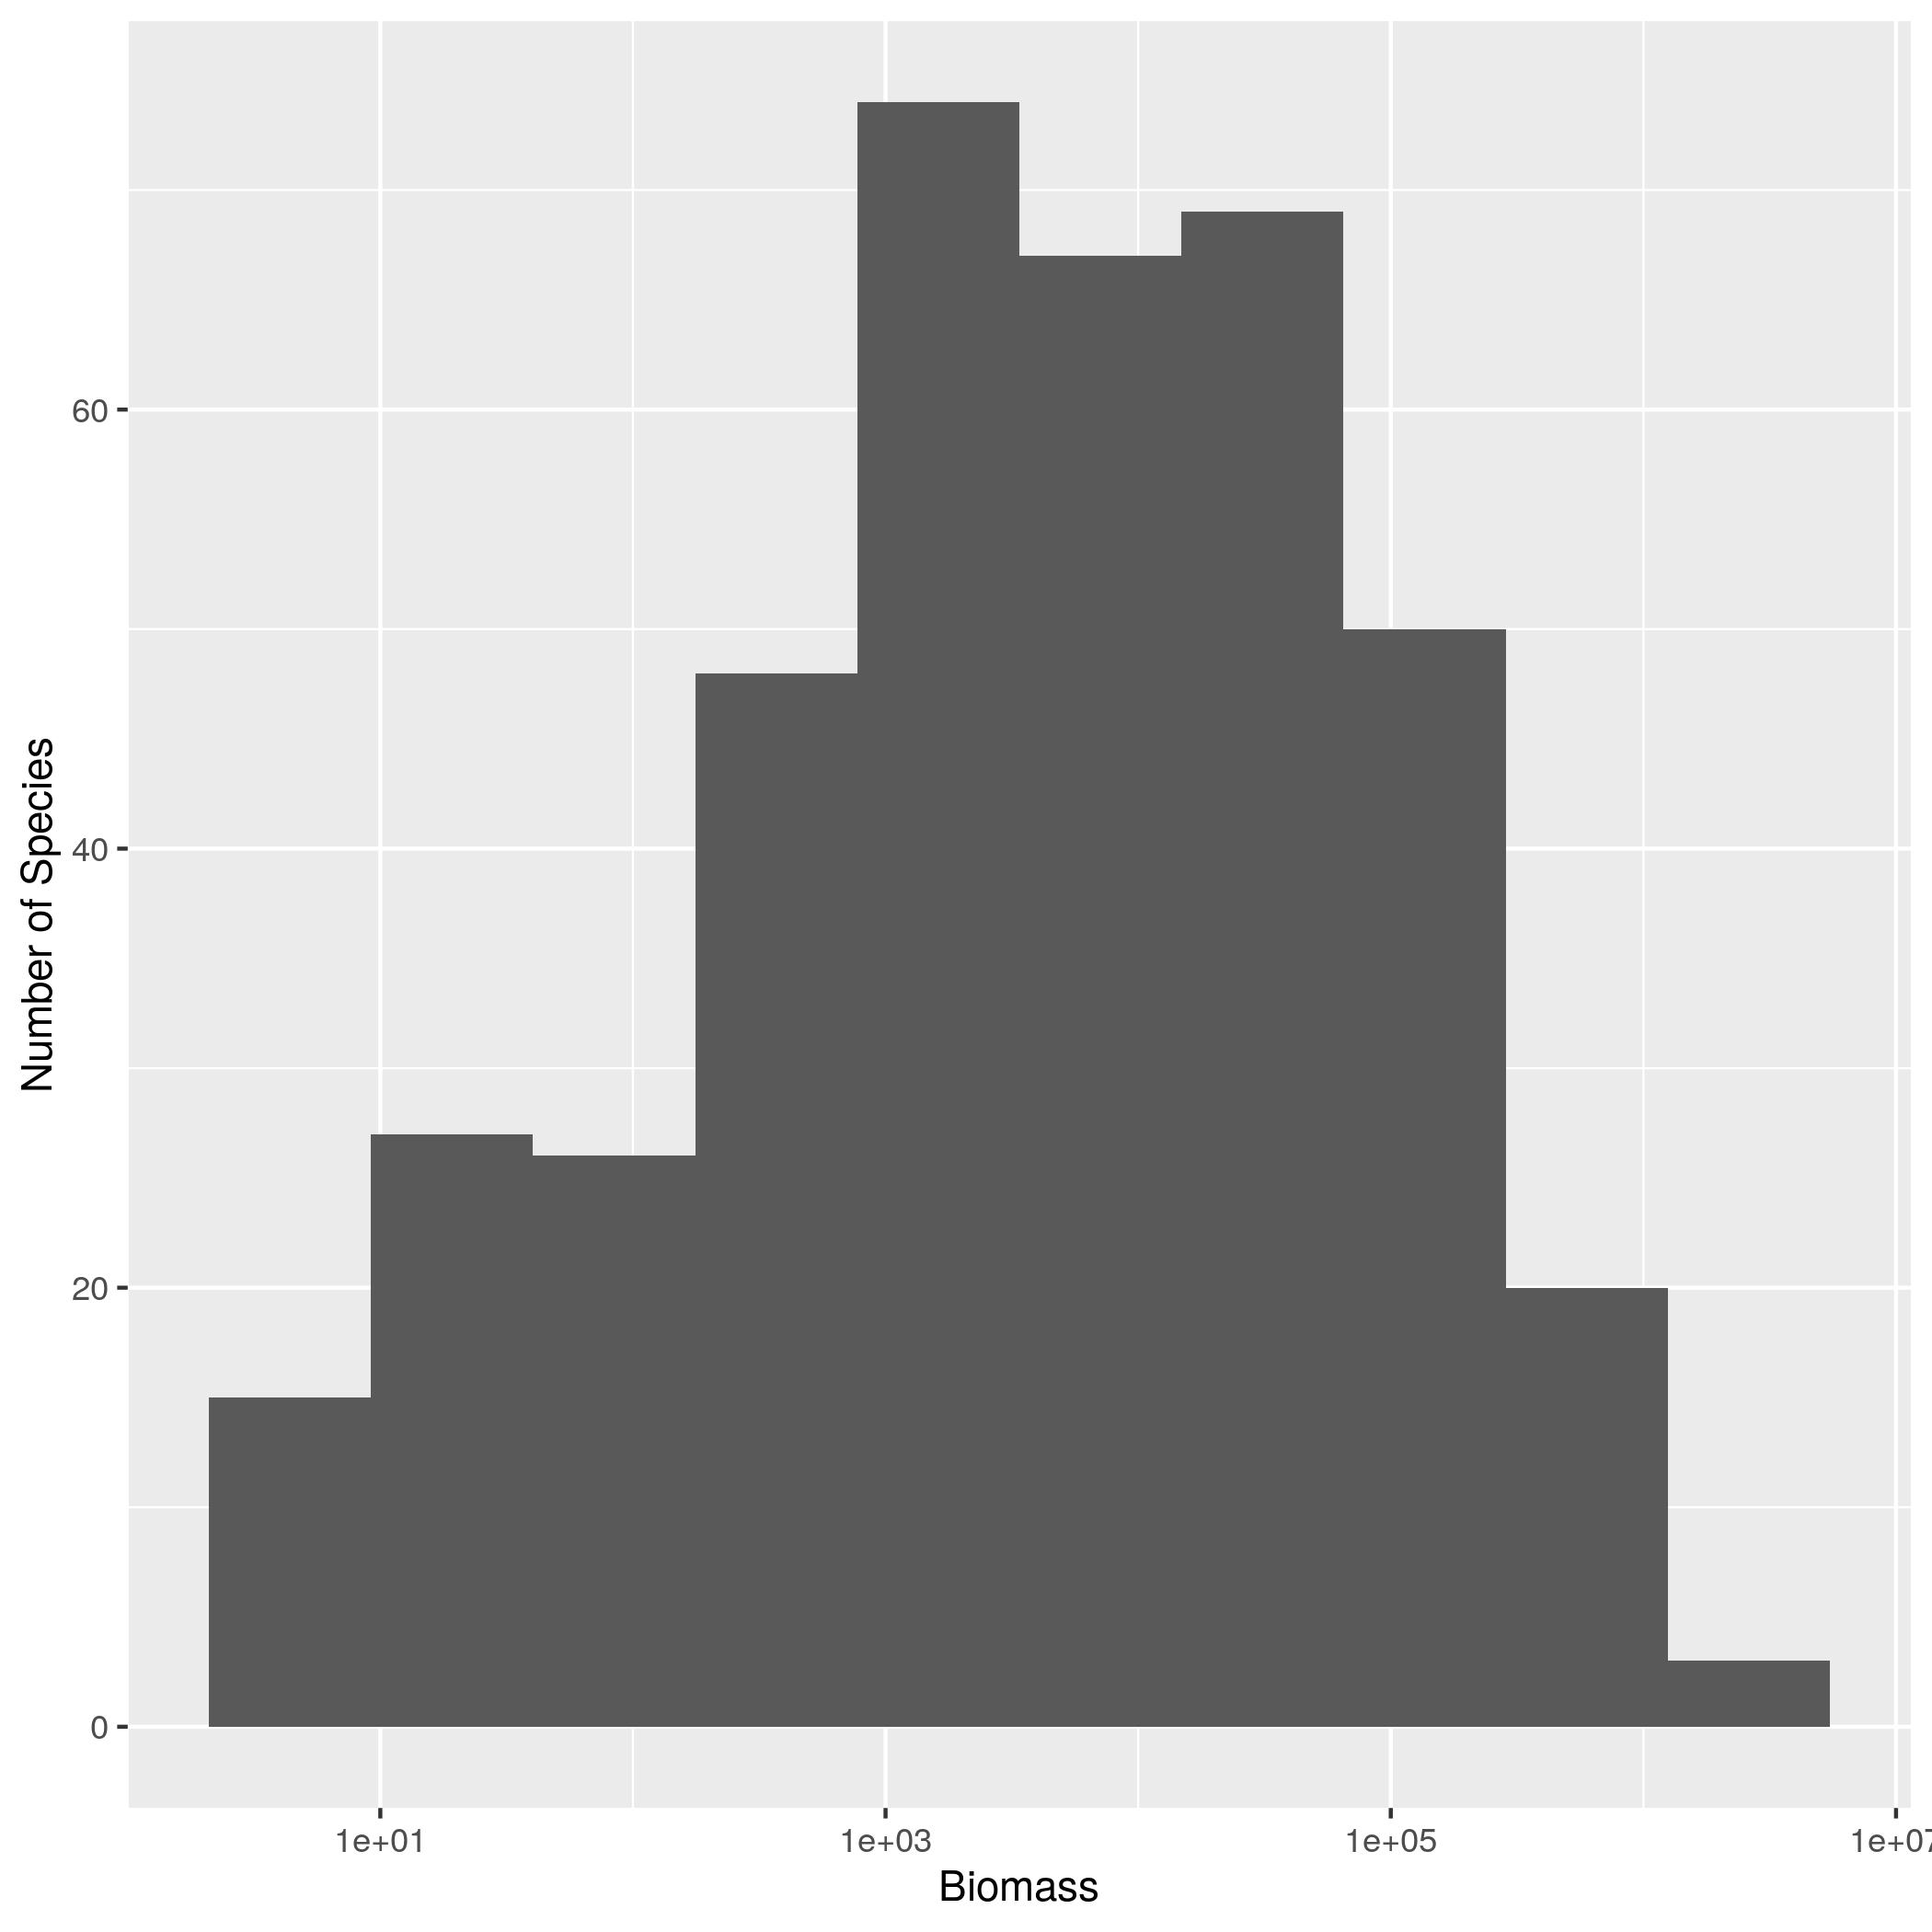
2. Plot a histogram of the species biomass values you just calculated.
- Use 10 bins in the histogram (using the
binsargument) - Use a log10 scale for the x axis (using
scale_x_log10) - Change the x axis label to
Biomassand the y axis label toNumber of Species(usinglabs)
- If the file